
Anthony Crawford
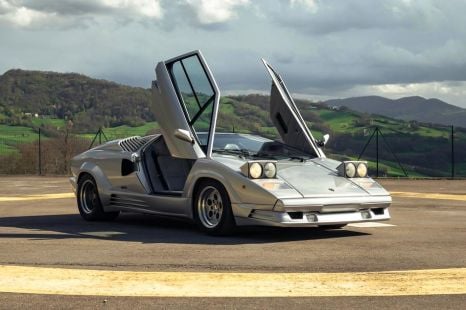
1990 Lamborghini Countach review
Is driving a 35-year-old example of the car of your dreams everything you think it will be? Tony drives the Lamborghini Countach to find out.
5 Days Ago
The Australian car market will almost certainly reset the record books in 2023, but there are storm clouds on the horizon...

Senior Contributor
Senior Contributor
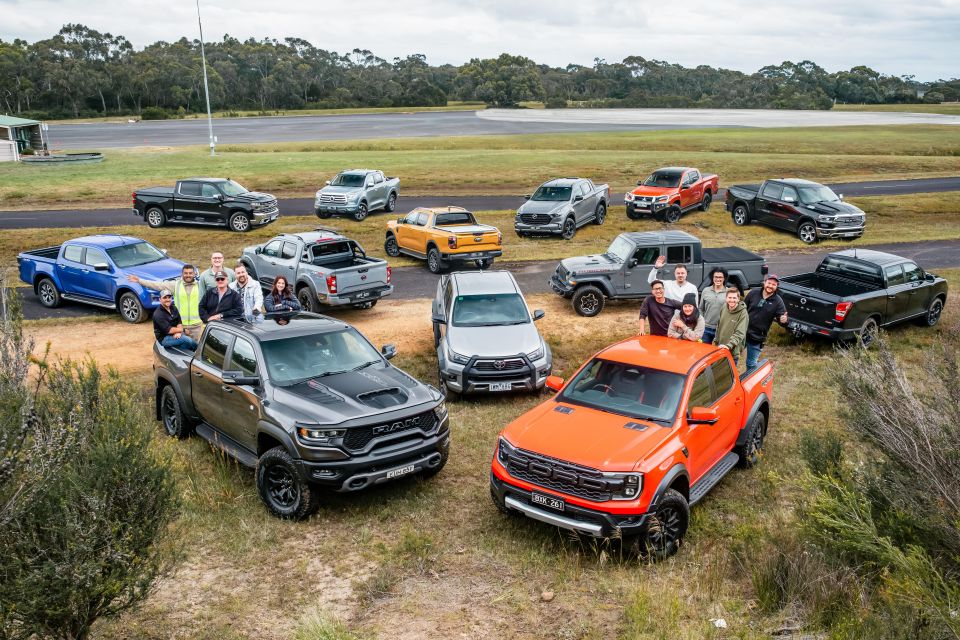
The Australian new vehicle market continues to go hell-for-leather as better supply allows car manufacturers to clear order backlogs and fleets to replenish.
November 2023 produced yet another record – six of the past seven months have done so – with 112,141 new cars and commercials counted as sold, up 17.9 per cent.
More importantly it means that 2023 will almost certainly produce an all-time yearly sales record for Australia of around 1.2 million units.
The Australian market totalled 1,118,236 sales (up 12.6 per cent) to the end of November, meaning it’s only 70,880 sales away from eclipsing the 2017 record tally of 1,189,116 units.
However, it’s important to also point out that the record numbers we’re seeing are to a fair degree a reflection of pent-up demand resulting from COVID-era shortages.
As backorder banks subside and economic hardships caused by high inflation and increasing interest rates bite down, expect the market to cool. Many dealer forward order-writes suggest this is already occurring behind the scenes.
“Another record-breaking month underscores the dynamic and competitive nature of Australia’s automotive landscape, showcasing the wide array of choices available to consumers,” said Tony Weber, head of the Federal Chamber of Automotive Industries peak lobby group.
“As the challenges of the past year’s supply chain disruptions recede, consumers have greater access to a broad range of choices and increased accessibility in the market. The automotive sector remains a testament to the resilience and adaptability of both industry players and consumers alike.
“However, as cost-of-living pressures hit we may see a market cooling in the coming months, and we anticipate a more challenging 2024.”
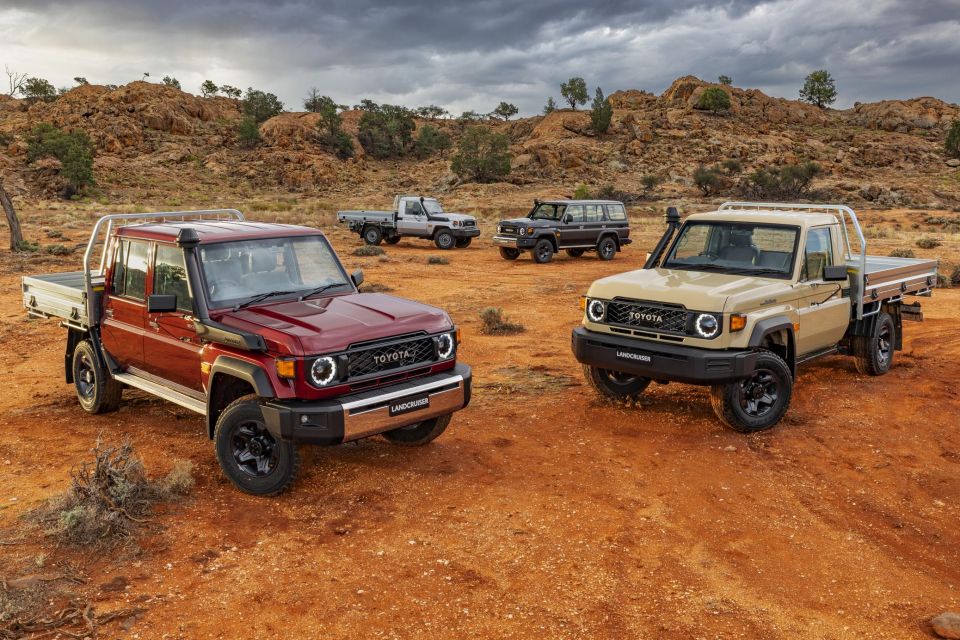
Toyota’s market share remains lower than the long-term average (18.7 per cent for November) but it’s showing signs of growth and remains the market’s dominant player.
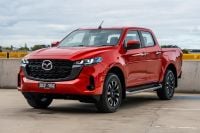
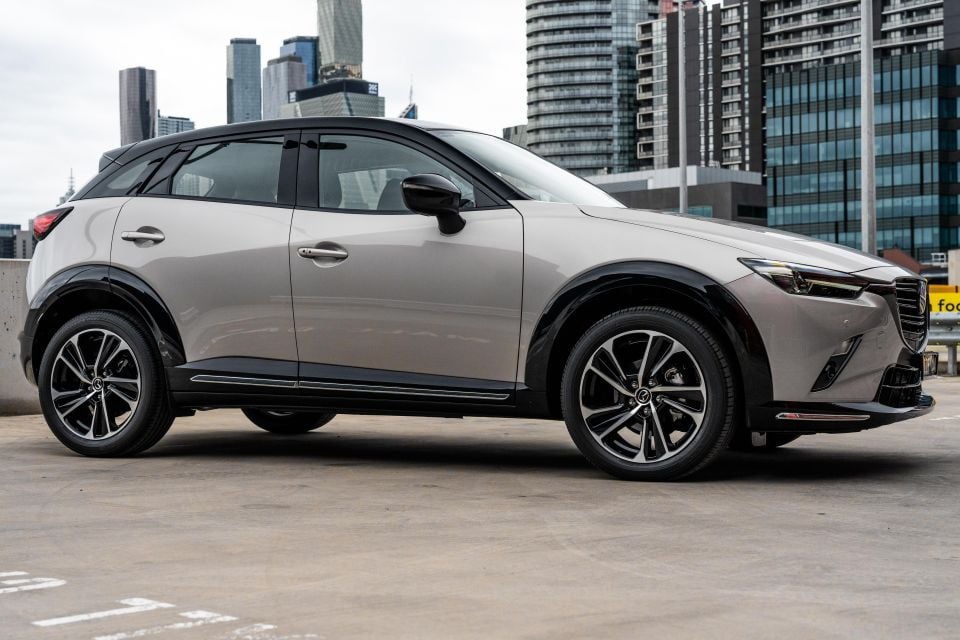
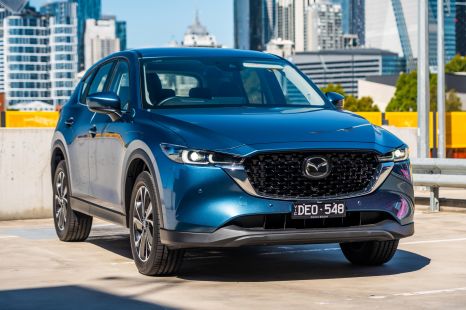
Mazda remains comfortable in second year-to-date and grew a healthy 15.3 per cent in November, with Ford rounding out the podium (up 14 per cent).
Hyundai’s volume grew a healthy 21.7 per cent over November 2022, and YTD it’s neck-and-neck with little sibling Kia (70,296 versus 70,537, with Kia maintaining a slender lead).
Mitsubishi turned a corner after a tough few months to grow 12.8 per cent for the month (it’s still down 19.0 per cent YTD though).
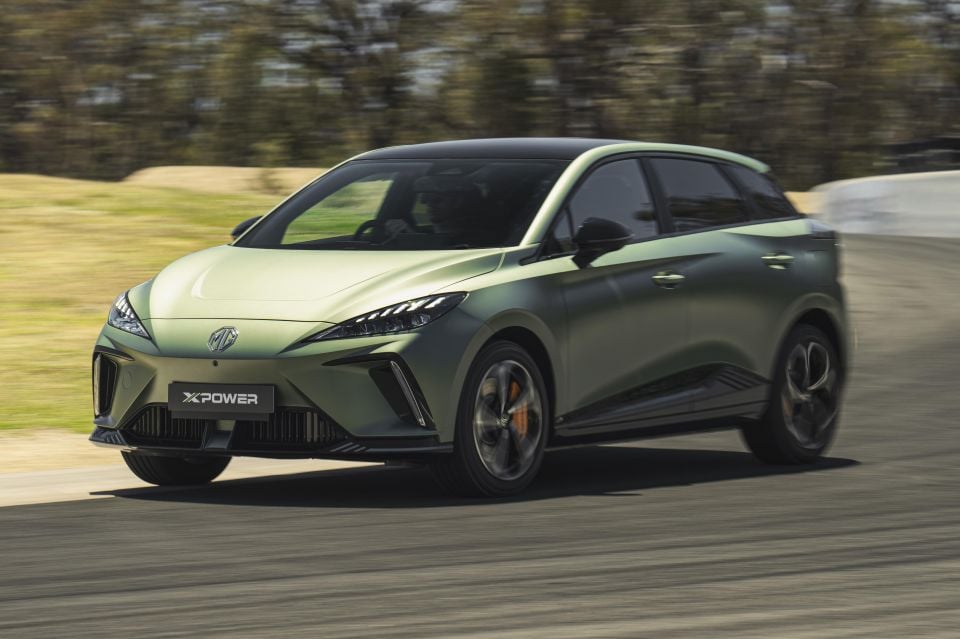
Rounding out the top 10 were Kia (down 5.8 per cent), MG (up 1.9 per cent), Isuzu Ute (up a massive 73.4 per cent), Nissan (up an even healthier 148.9 per cent thanks to its revitalised SUV line-up), and Volkswagen (up 31.5 per cent as European supply improves).
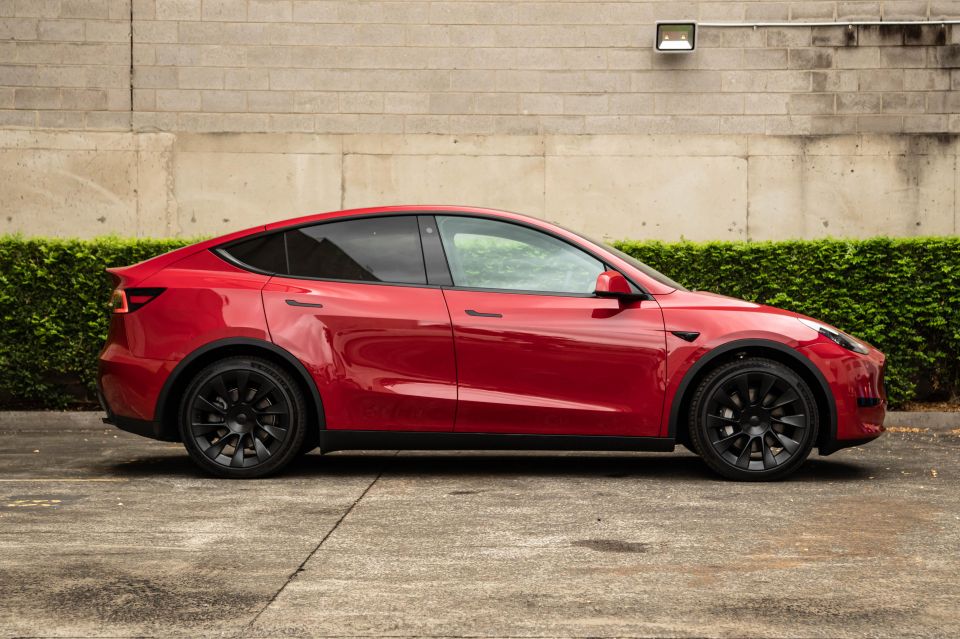
Despite growing volume 79.4 per cent YoY, Tesla finished 11th, and its share of the total EV market declined to 45.6 per cent. It’s traditionally owned 60 per cent or more of the sector until recently but now has more competition.
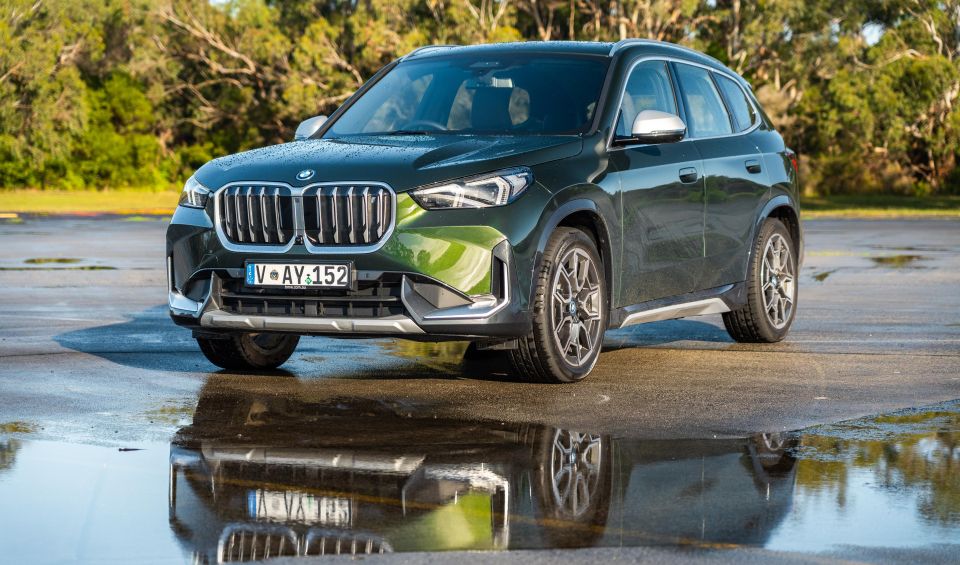
On the luxury side of things, BMW (2669 sales, up 64.7 per cent) has re-established itself as the top player, ahead of Mercedes-Benz even including the latter’s van range for which BMW has no competitors.
If we just look at passenger car and SUV sales, Mercedes-Benz in November (1997 sales) trailed both BMW as well as Audi (2023 sales). Meanwhile Lexus stayed on record pace with 1271 sales for the month, up 124.2 per cent.
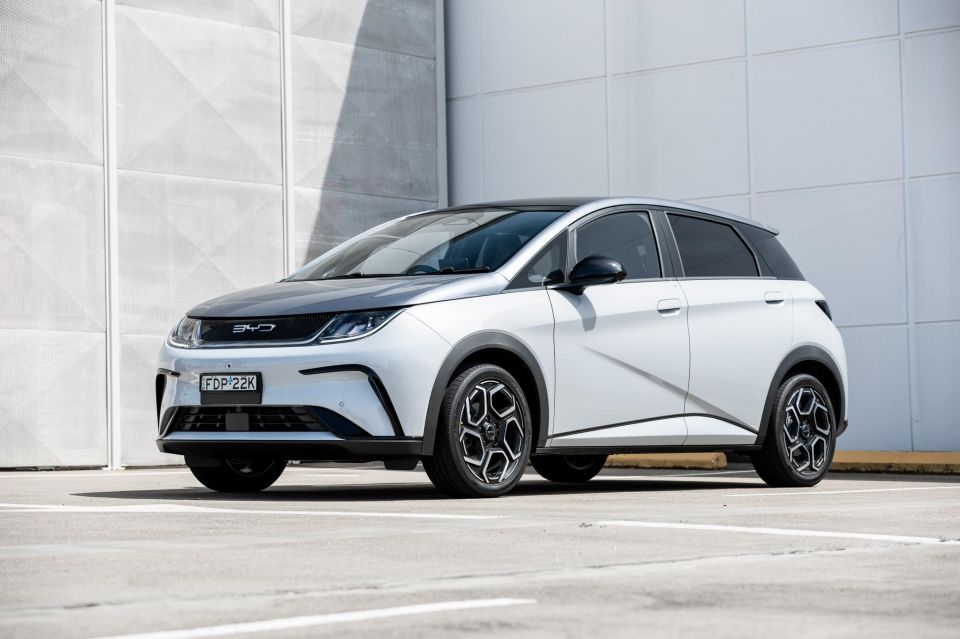
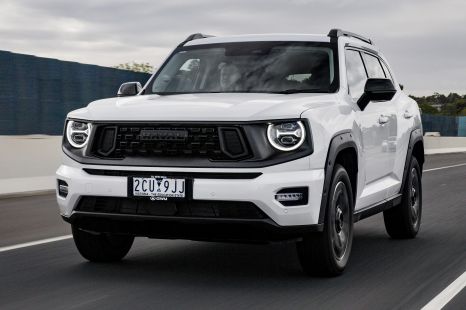
In terms of some of the newer brands on the market, the best performers were GWM (Haval, Tank and Ora included) with 3680 sales, BYD (1257 sales, just one unit behind Honda), Chery (825 sales, ahead of Skoda), and Cupra (514).
See the full list of November sales by brand below:
| Brand | Nov sales | % Change YoY |
|---|---|---|
| Toyota | 21,002 | 4.5% |
| Mazda | 8707 | 15.3% |
| Ford | 8165 | 14.0% |
| Hyundai | 6718 | 21.7% |
| Mitsubishi | 6268 | 12.8% |
| Kia | 5767 | -5.8% |
| MG | 5603 | 1.9% |
| Isuzu Ute | 4853 | 73.4% |
| Nissan | 4268 | 148.9% |
| Volkswagen | 4004 | 31.5% |
| Tesla | 3939 | 79.4% |
| Subaru | 3825 | 3.4% |
| GWM | 3680 | 26.3% |
| BMW | 2669 | 64.7% |
| Mercedes-Benz | 2605 | 9.5% |
| Audi | 2023 | 22.0% |
| LDV | 1836 | 0.5% |
| Suzuki | 1416 | -22.2% |
| Lexus | 1271 | 124.2% |
| Honda | 1258 | 21.0% |
| BYD | 1257 | 48.8% |
| Chery | 825 | NEW |
| Skoda | 767 | 33.4% |
| Land Rover | 755 | 215.9% |
| Volvo Car | 713 | -19.3% |
| Renault | 543 | -10.2% |
| Cupra | 514 | 70.2% |
| SsangYong | 473 | 3.3% |
| Porsche | 399 | 5.3% |
| Chevrolet | 377 | 34.6% |
| Ram | 372 | -47.6% |
| Jeep | 329 | -27.9% |
| Mini | 314 | 155.3% |
| Peugeot | 230 | 33.7% |
| Polestar | 191 | -20.4% |
| Genesis | 190 | 115.9% |
| Fiat | 152 | 51.0% |
| Alfa Romeo | 97 | 94.0% |
| Jaguar | 68 | 126.7% |
| Maserati | 55 | 17.0% |
| Lamborghini | 25 | 31.6% |
| Lotus | 22 | N/A |
| Aston Martin | 21 | 425.0% |
| Ferrari | 18 | 63.6% |
| Bentley | 15 | 25.0% |
| Citroen | 11 | -54.2% |
| Rolls-Royce | 5 | 150.0% |
| McLaren | 3 | -25.0% |
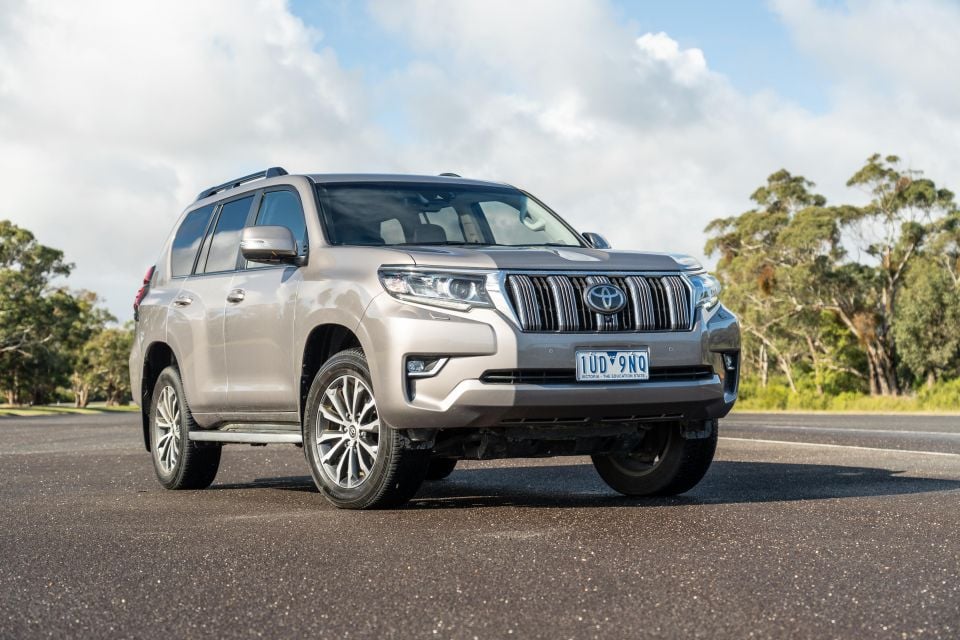
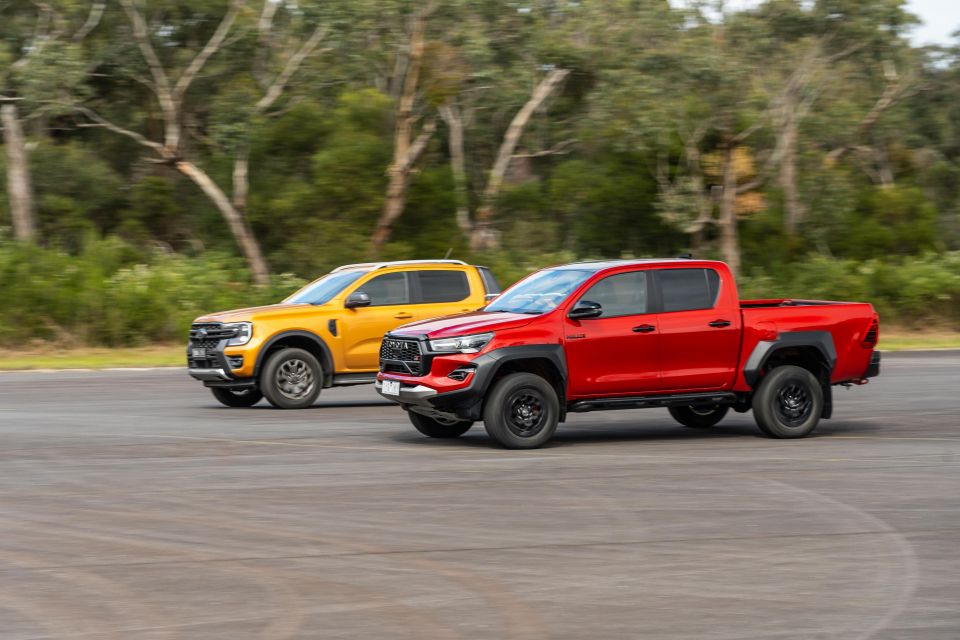
The Ford Ranger was the top-selling vehicle recording 6301 sales, followed by Toyota HiLux (5901), Isuzu D-Max (3692) Tesla Model Y (3151), and Toyota Prado (3090).
The Ranger has a serious chance at toppling the mighty HiLux in 2023 as Australia’s biggest-selling vehicle, with 55,589 sales YTD with one month to go, versus 55,968 for the Toyota.
EV-specific model top-sellers*:
Doesn’t include models with both ICE and EV options e.g. MG ZS or Hyundai Kona. We will run a full EV breakdown when we get more data
Sales by region
Category breakdown
Top segments by market share
Sales by buyer type
Sales by propulsion or fuel type
Sales by country of origin
Got any questions about car sales? Ask away in the comments and we’ll jump in!
Anthony Crawford
5 Days Ago

Matt Campbell
4 Days Ago

James Wong
3 Days Ago

Max Davies
2 Days Ago

Josh Nevett
20 Hours Ago

William Stopford
17 Hours Ago