Shane O'Donoghue
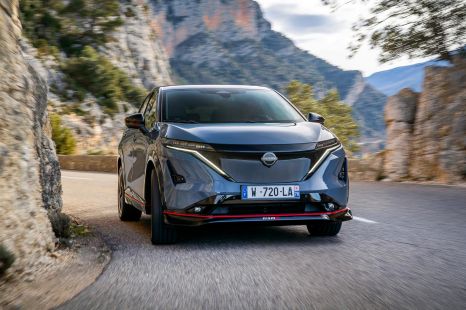
2025 Nissan Ariya Nismo review: Quick drive
Nissan is hoping the allure of its Nismo badge – and the engineering that underpins it – will bolster the success of its Ariya electric SUV.
6 Days Ago
Another bumper month sees the market on record pace, but chalk much of this up to the easing of backorders thanks to better supply.

Senior Contributor

Senior Contributor
Australian new vehicle deliveries are booming, having set a new all-time September record on the back of improved supply and the clearing of backorders, new figures have revealed.
Industry-supplied VFACTS data for September 2023 recorded 110,702 new vehicle sales, up 18.3 per cent on the same month in 2022. Four of the previous five months have reset all-time records: May, July, August and now September.
Year-to-date (YTD) sales over the first nine months of 2023 sit at 899,286 units, putting the market on pace to set a new record if the momentum remains.
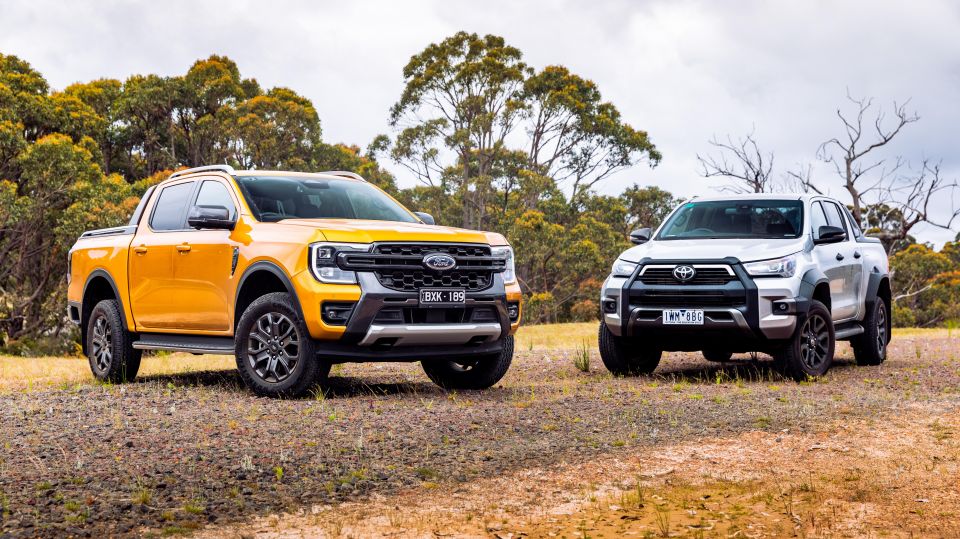
Market leader Toyota continues rectifying its massive backlog – at one point some core cars had two-year wait times or more – by growing around 40 per cent, with the HiLux edging out the Ford Ranger to be 1-2 in the charts.
The nation’s third overall top-selling vehicle, as well as the number one SUV, was the Tesla Model Y, reflecting ongoing demand for electric vehicles (EVs) which overall were up 21.7 per cent as a fuel type.
EVs ended up with around 10.6 per cent passenger and SUV market share and about 8 per cent of the total market including commercials. The market share of electrified passenger cars and SUVs (hybrid, PHEV and EV) was a tick under 25 per cent.
“Our advice is that the supply of vehicles into Australia, including electric vehicles, continues to improve so those consumers who want to buy a new vehicle should visit a dealer or manufacturer,” said FCAI chief executive Tony Weber. As he would…
| September of | Monthly sales | YTD |
|---|---|---|
| 2023 | 110,702 | 899,286 |
| 2022 | 93,555 | 811,130 |
| 2021 | 83,312 | 816,140 |
| 2020 | 68,985 | 644,891 |
| 2019 | 88,181 | 811,464 |
Market leader Toyota continued to trim back its massive order backlog with 20,912 sales in September, up 40.8 per cent over August 2023, sufficient to take 18.9 per cent market share.
Mazda (8031 sales, up 10.6 per cent) and Ford (8015 sales, up 20.8 per cent) were neck-and-neck on the podium, ahead of sibling brands Kia (7303, up 0.2 per cent) and Hyundai (6217, down 4.4 per cent).
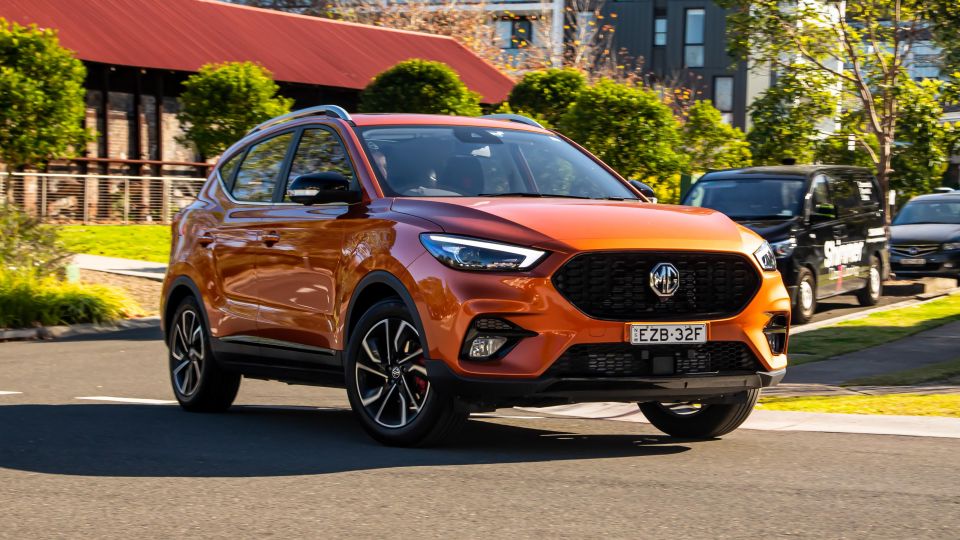
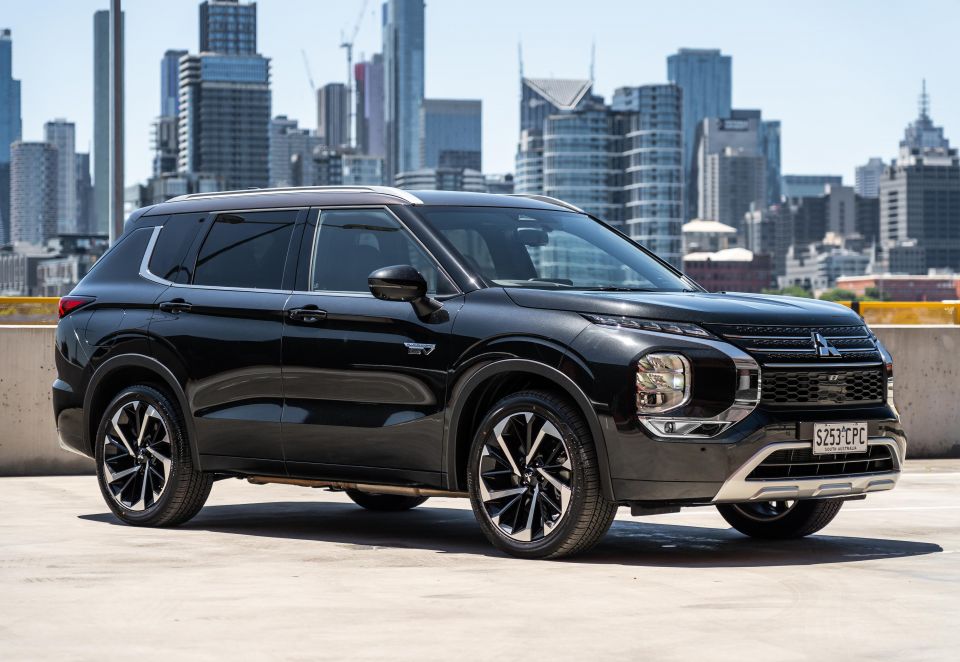
Rounding out the top 10 were Mitsubishi (down 15.1 per cent with its Triton on runout), MG (up 65.6 per cent), Tesla (down 13.3 per cent for the month but up 171 per cent YTD), Nissan (up 153.8 per cent thanks to an influx of new product), and Subaru (up 35.8 per cent).
Knocking on the door were Volkswagen (up 13.1 per cent), Isuzu Ute (up 36.5 per cent and fresh off an all-time record haul in August), GWM (despite being down 5 per cent), and BMW (up 15.8 per cent, vanquishing its Mercedes-Benz nemesis brand even with the latter’s commercial van sales included).
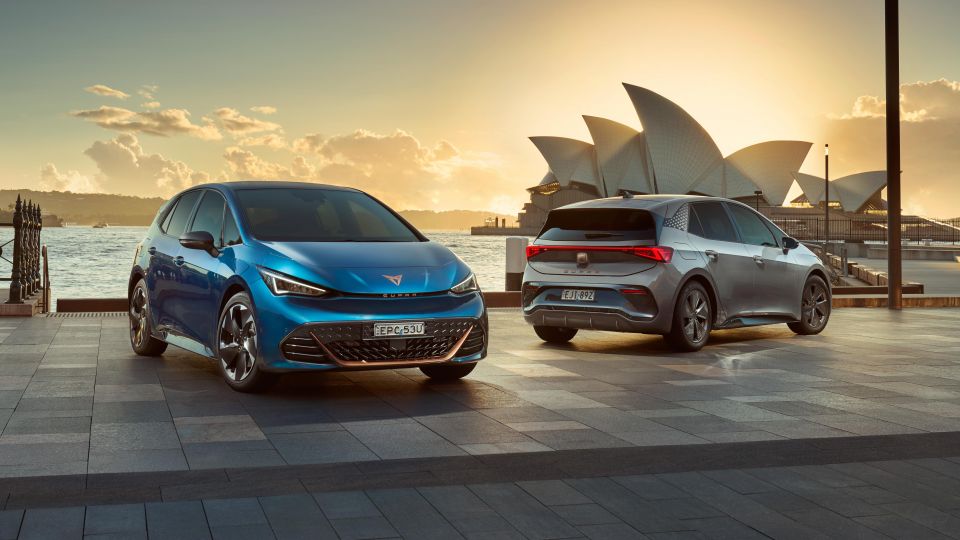
Smaller-volume OEMs that recorded good sales growth included Lexus (another record-setting haul, up 267.2 per cent), Land Rover (up 286.5 per cent with the arrival of new stock and new models), Skoda (up 35 per cent), Porsche (up 101.5 per cent), and Cupra (up 111.1 per cent).
Examples of brands that had poor delivery results included the aforementioned Mitsubishi (down 15.1 per cent), Mercedes-Benz (down 23.2 per cent), Suzuki (down 15.2 per cent), Honda (down 16.4 per cent and finishing in 20th spot), Volvo (down 18.5 per cent), and Jeep (down 40.5 per cent).
| Brand | Sales | Change YoY |
|---|---|---|
| Toyota | 20,912 | 40.8% |
| Mazda | 8031 | 10.6% |
| Ford | 8015 | 20.8% |
| Kia | 7303 | 0.2% |
| Hyundai | 6217 | -4.4% |
| Mitsubishi | 5761 | -15.1% |
| MG | 5400 | 65.6% |
| Tesla | 5177 | -13.3% |
| Nissan | 4784 | 153.8% |
| Subaru | 4302 | 35.8% |
| Volkswagen | 4184 | 13.1% |
| Isuzu Ute | 3932 | 39.5% |
| GWM | 2897 | -5.0% |
| BMW | 2354 | 15.8% |
| Mercedes-Benz | 2031 | -23.2% |
| LDV | 1665 | 1.5% |
| Audi | 1625 | 13.6% |
| Lexus | 1498 | 267.2% |
| Suzuki | 1467 | -15.2% |
| Honda | 1052 | -16.4% |
| Land Rover | 885 | 286.5% |
| Volvo | 816 | -18.5% |
| Skoda | 764 | 35.0% |
| Renault | 756 | 10.5% |
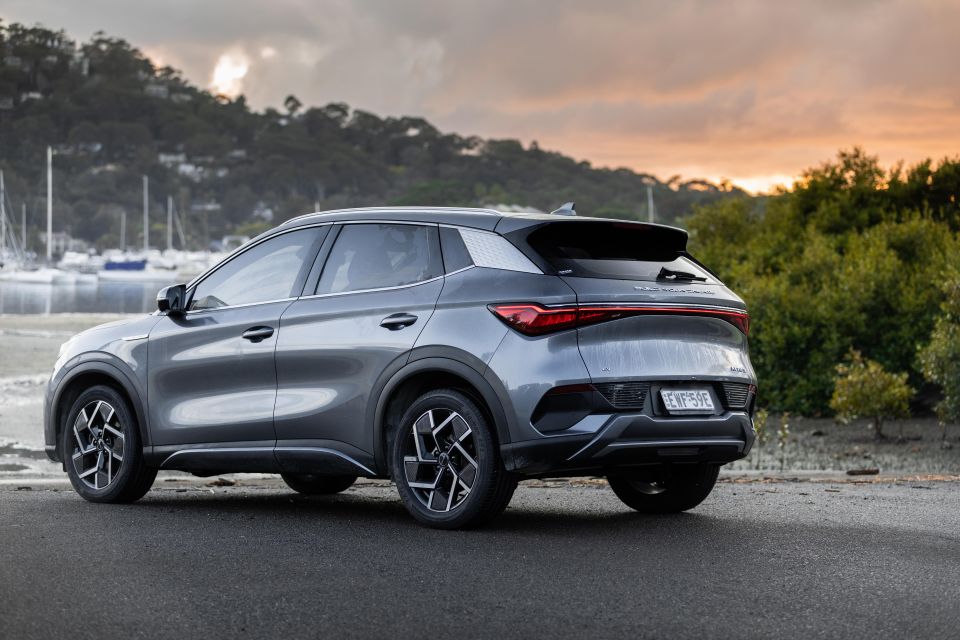
| BYD | 702 | – |
| Porsche | 665 | 101.5% |
| Ram | 654 | 8.5% |
| Chery | 624 | – |
| Mini | 489 | 42.2% |
| Cupra | 420 | 111.1% |
| SsangYong | 374 | -6.5% |
| Chevrolet | 372 | 38.8% |
| Jeep | 343 | -40.5% |
| Genesis | 200 | 75.4% |
| Peugeot | 196 | 40.0% |
| Fiat | 193 | 116.7% |
| Polestar | 111 | 30.6% |
| Alfa Romeo | 66 | 13.8% |
| Maserati | 49 | -27.9% |
| Jaguar | 48 | -17.2% |
| Lamborghini | 33 | 50.0% |
| Citroen | 27 | 285.7% |
| Lotus | 26 | – |
| Bentley | 25 | 4.2% |
| Ferrari | 23 | – |
| Aston Martin | 12 | -7.7% |
| McLaren | 5 | – |
| Rolls-Royce | 4 | -50.0% |
The HiLux and Ranger, per usual, topped the charts, with the Toyota winning overall but Ford leading the more desirable and profitable 4×4 sales race.
With the Isuzu D-Max in fourth spot, three of the top quartet were utes, suggesting the ATO’s end of instant asset write-off for vehicles hasn’t impacted things hugely – at least not yet.
The Tesla Model Y was third overall and the number one SUV. In fifth was the Toyota RAV4, ahead of the rival Mitsubishi Outlander and smaller MG ZS. Rounding out the top 10 were the Toyota Corolla (the sole traditional passenger vehicle in the list), Kia Sportage, and the Ford Everest – which narrowly edged out its Toyota Prado arch rival.
The below 30 top-selling vehicles accounted for about 56 per cent of the total passenger, SUV and light commercial market, reflecting the degree of concentration at the top of the charts.
Sales for September 2023 by model:
EV-specific models top-sellers*:
Doesn’t include models with both ICE and EV options eg. MG ZS or Hyundai Kona. We will run a full EV breakdown this week when we get more data
Sales by region
Category breakdown
Top segments by market share
Sales by buyer type
Sales by propulsion or fuel type
Sales by country of origin
Got any questions about car sales? Ask away in the comments and we’ll jump in!
Shane O'Donoghue
6 Days Ago

Anthony Crawford
5 Days Ago

Matt Campbell
4 Days Ago

James Wong
3 Days Ago

Max Davies
1 Day Ago

Josh Nevett
12 Hours Ago