
Anthony Crawford
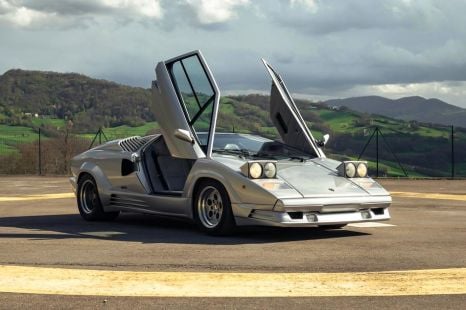
1990 Lamborghini Countach review
Is driving a 35-year-old example of the car of your dreams everything you think it will be? Tony drives the Lamborghini Countach to find out.
6 Days Ago
Electric vehicles hit 8.0 per cent share as both Teslas make the top 10, while market-leader Toyota continues to struggle with deliveries.

Senior Contributor
Senior Contributor
New vehicle deliveries in Australia climbed a modest 1.3 per cent in April over the same month last year, finishing at 82,137 units.
This was driven entirely by growth in SUV sales (up 8.6 per cent), with both light commercials (down 13.1 per cent) and passenger cars (down 1.6 per cent) going in the other direction.
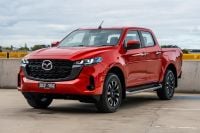
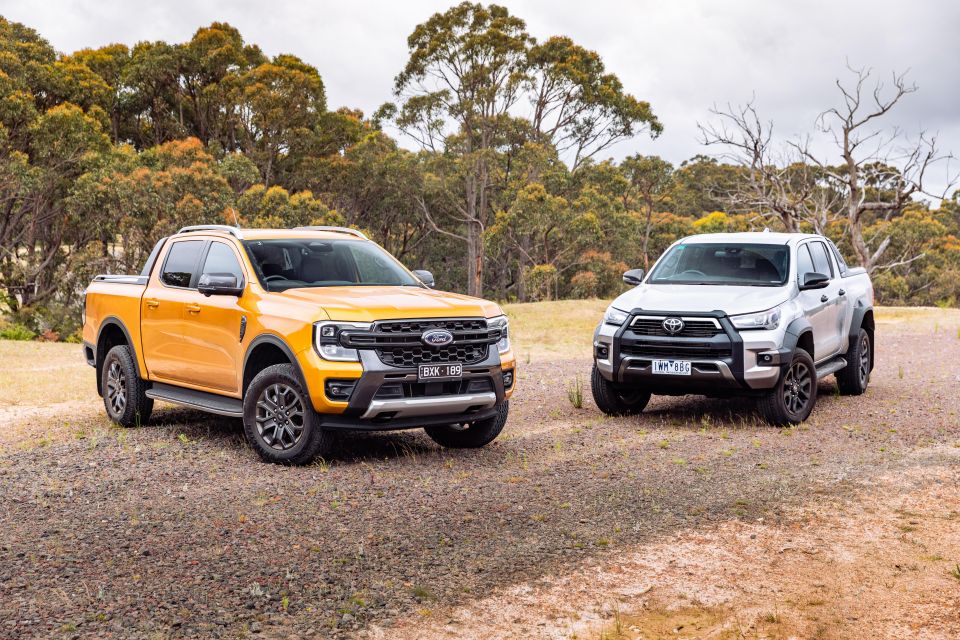
The Ford Ranger topped the charts, narrowly ahead of its Toyota HiLux nemesis, with Toyota’s RAV4 rounding out the podium.
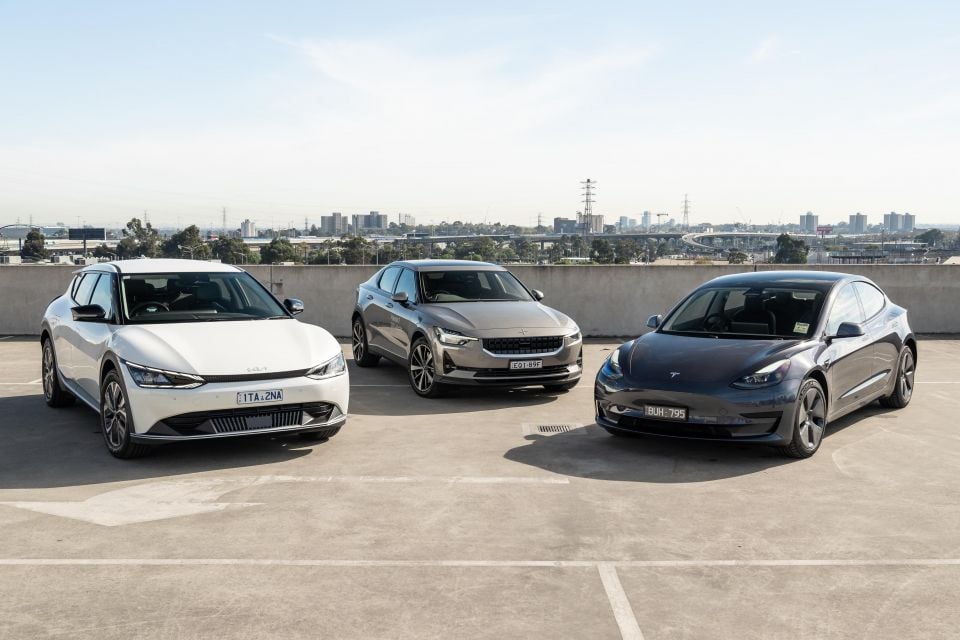
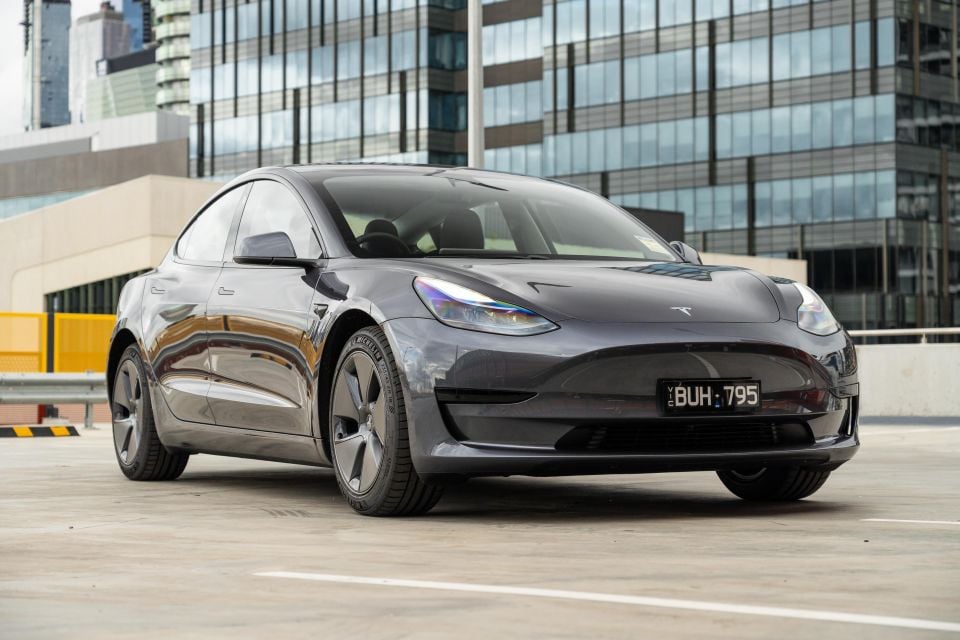
More notable perhaps is the presence of both Tesla models – Model 3 and Model Y – in the overall top 10, helping push EV market share to an increasingly significant 8.0 per cent.
“This is well up from 1.1 per cent compared with April 2022,” said Tony Weber, chief executive of the Federal Chamber of Automotive Industries (FCAI) – the peak lobby group for car brands.
“If you take all forms of electrification, that number has increased from 9.5 per cent to 15.4 per cent, and we know that this number would have been larger had the industry not faced global supply challenges.”
There were 22 selling days in April 2023 compared to 23 in April 2022, so this resulted in an increase of 208.9 vehicle sales per day.
The mild sales growth in April took the market to 351,139 sales after four months, up 2.2 per cent YTD. This is slightly higher than the rolling 10-year average, as the table below shows.
| Year | April only | Jan-April |
|---|---|---|
| 2023 | 82,137 | 351,139 |
| 2022 | 81,065 | 343,501 |
| 2021 | 92,347 | 355,995 |
| 2020 | 38,926 | 272,287 |
| 2019 | 75,550 | 344,088 |
| 2018 | 82,930 | 374,468 |
| 2017 | 83,135 | 362,480 |
| 2016 | 87,571 | 372,899 |
| 2015 | 81,656 | 359,250 |
| 2014 | 80,710 | 347,080 |
Long-time market leader Toyota continues to be held back by lack of stock, with its sales tumbling 33 per cent year-on-year (YoY) and its market share down at 14.6 per cent, compared to its regular share north of 20 per cent.
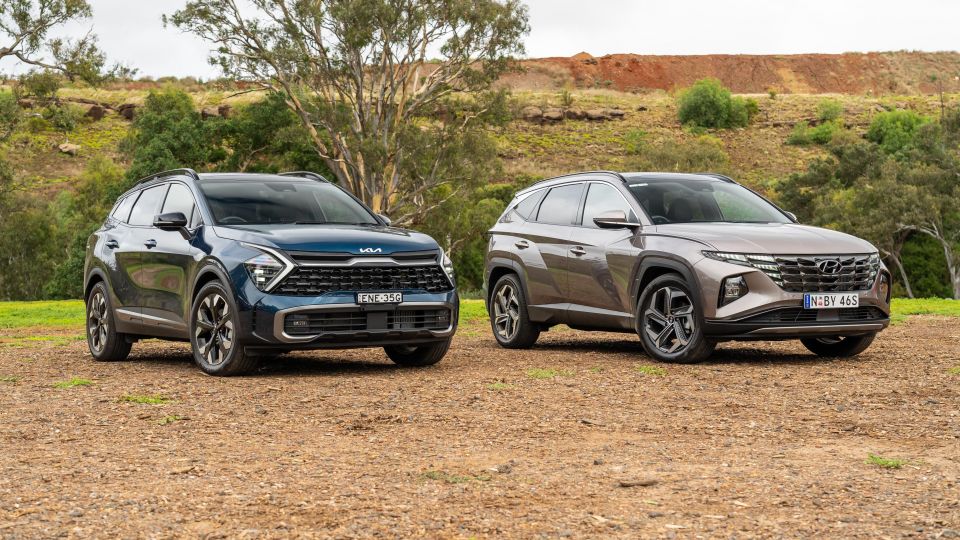
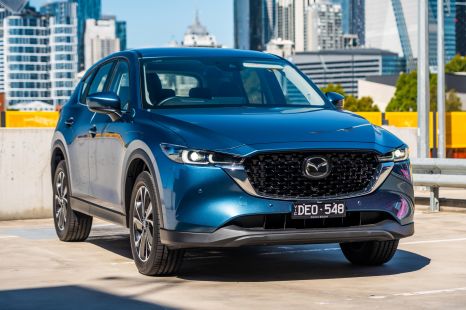
But it was still well ahead of Mazda in second on 6926 (down 6.1 per cent). Kia and Hyundai finished third and fourth respectively, with the former continuing to turn the tables on the latter as Australia’s new favourite Korean brand.
Ford (up 1.5 per cent) rounded out the top five, ahead of Mitsubishi in sixth despite a 31.3 per cent decline. Seventh was Tesla with off-the-charts growth and 3676 sales, ahead of MG (sales declined 27.4 per cent), Nissan (up 46.8 per cent thanks to a brand new SUV range), and Volkswagen (up 71.8 per cent as supply out of Europe improves).
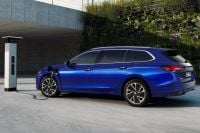
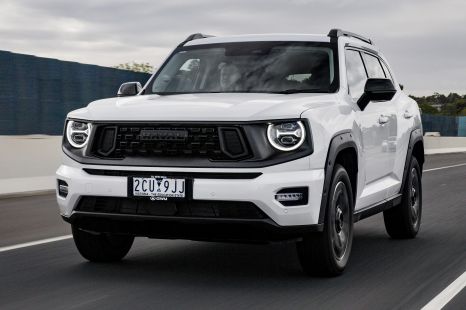
Next were Isuzu Ute (down 4.2 per cent despite the MU-X being the nation’s number one large SUV), Subaru (up 52.7 per cent), Mercedes-Benz (down 7.3 per cent), GWM including Haval (up 63.8 per cent), and BMW (up 5.2 per cent).
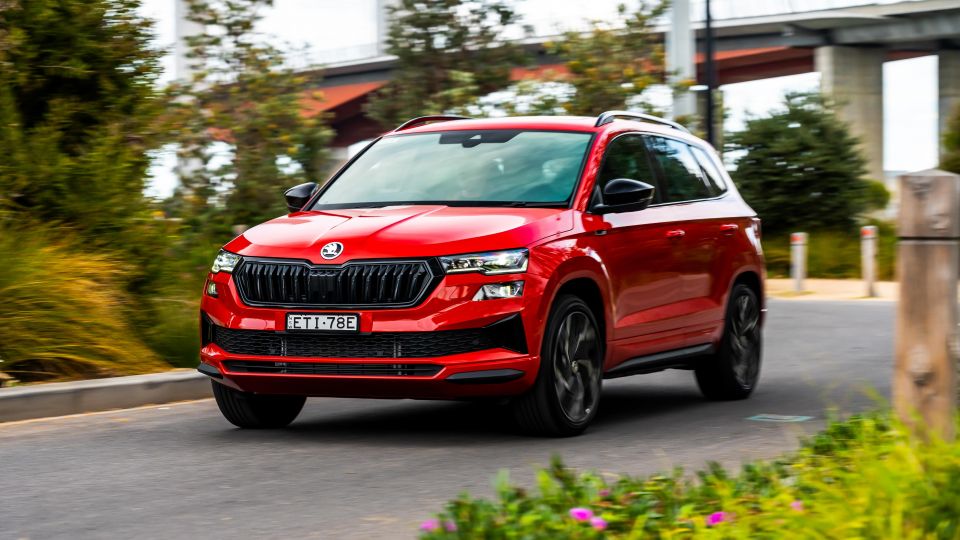
A few household names that battled in April were Suzuki (down 35.4 per cent), former heavyweight Honda (in 22nd spot and down in volume by 17.1 per cent), Skoda (down 16.4 per cent – unlike its fellow VW Group brands), and Jeep (down 7.7 per cent).
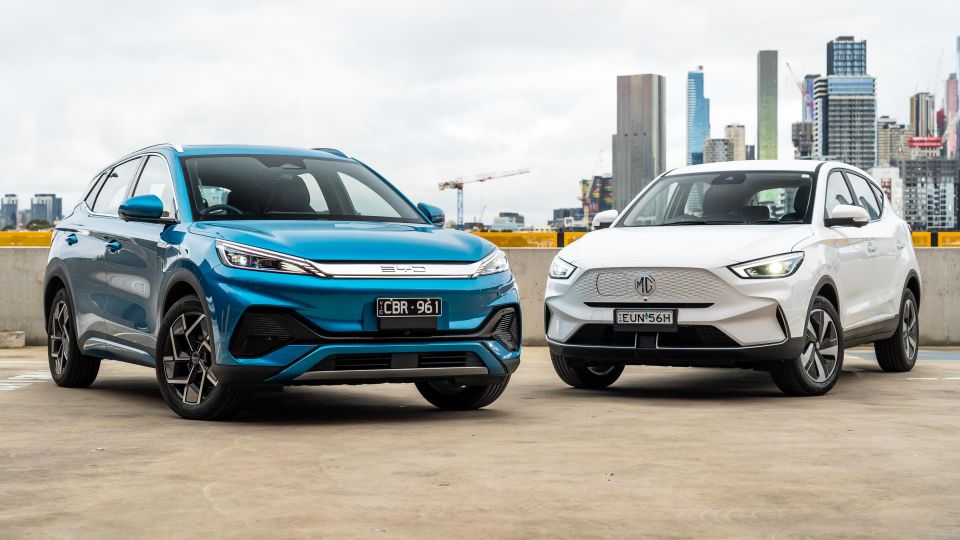
Figures for the market’s newest brands in finish order included BYD (1118 sales and a top 20 finish), Chery (425 sales from its just-launched Omoda 5 as it grows its dealer network under a factory distributor), Cupra (159 units), and Polestar (122 units).
| Brand | April sales | Change % |
|---|---|---|
| Toyota | 12,029 | -33.0% |
| Mazda | 6926 | -6.1% |
| Kia | 6200 | 0.3% |
| Hyundai | 5732 | 3.2% |
| Ford | 5047 | 1.5% |
| Mitsubishi | 4440 | -31.3% |
| Tesla | 3676 | >999% |
| MG | 3463 | -27.4% |
| Nissan | 3009 | 46.8% |
| Volkswagen | 2957 | 71.8% |
| Isuzu Ute | 2904 | -4.2% |
| Subaru | 2511 | 52.7% |
| Mercedes-Benz | 2487 | -7.3% |
| GWM | 2216 | 63.8% |
| BMW | 1750 | 5.2% |
| LDV | 1437 | 13.6% |
| Lexus | 1274 | 130.8% |
| Suzuki | 1153 | -35.4% |
| BYD | 1118 | NA |
| Audi | 1069 | 3.2% |
| Volvo Car | 1044 | 22.2% |
| Honda | 889 | -17.1% |
| Land Rover | 882 | 50.8% |
| Renault | 638 | 5.3% |
| Ram | 581 | 24.7% |
| Skoda | 498 | -16.4% |
| SsangYong | 485 | 195.7% |
| Chery | 425 | NA |
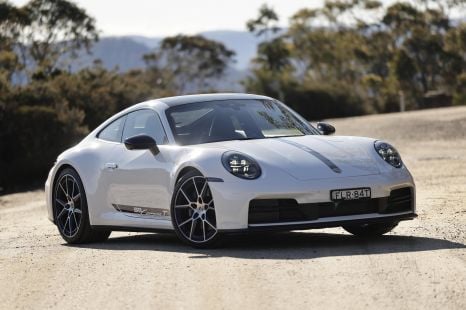
| Porsche | 399 | -17.0% |
| Jeep | 348 | -7.7% |
| Mini | 238 | 17.8% |
| Chevrolet | 234 | 30.0% |
| Peugeot | 184 | 75.2% |
| Genesis | 160 | 272.1% |
| Cupra | 159 | – |
| Fiat | 143 | 58.9% |
| Polestar | 122 | 31.2% |
| Maserati | 58 | 41.5% |
| Jaguar | 35 | -62.4% |
| Citroen | 27 | 17.4% |
| Alfa Romeo | 24 | -22.6% |
| Aston Martin | 16 | 45.5% |
| Ferrari | 11 | -26.7% |
| Lamborghini | 3 | -66.7% |
| Rolls-Royce | 3 | -50.0% |
| Lotus | 2 | -60.0% |
| Alpine | 0 | -100.0% |
| Bentley | 0 | -100.0% |
| Chrysler | 0 | -100.0% |
| McLaren | 0 | -100.0% |
Below is a list of the top 20-selling nameplates, comprising a dozen different manufacturers, 12 SUVs, five utes, and three passenger cars.

Sales by region
Category breakdown
Top segments by market share
Sales by buyer type
Sales by propulsion or fuel type
Sales by country of origin
Got any questions about car sales? Ask away in the comments and we’ll jump in!
Anthony Crawford
6 Days Ago

Matt Campbell
5 Days Ago

James Wong
4 Days Ago

Max Davies
2 Days Ago

Josh Nevett
1 Day Ago

Derek Fung
13 Hours Ago