William Stopford
The CarExpert team's favourite reveals from the Munich motor show
The 2025 Munich motor show hosted a raft of exciting reveals, but there were a few we loved more than the others.
3 Hours Ago
Private sales skyrocket, Toyota HiLux and Ford Ranger dominate again, surprise packet MG leapt into the top 10 brands, and Honda plummeted.

Senior Contributor
Senior Contributor
Australia’s new car sales grew 5.1 per cent for the month of February, over the tally recorded in February 2020.
VFACTS data published today by the Federal Chamber of Automotive Industries (FCAI) shows that 83,977 new cars, SUVs and commercials were counted as sold.
This takes the year-to-date (YTD) tally to 163,643 vehicles, up 7.9 per cent – a figure driven more by the stronger January result.
Widespread stock shortfalls and a short COVID-19-related lockdown in Victoria were examples of headwinds. The February 2021 sales tally is still behind the Febraury 2019 (87,102) and February 2018 (95,999) tallies.
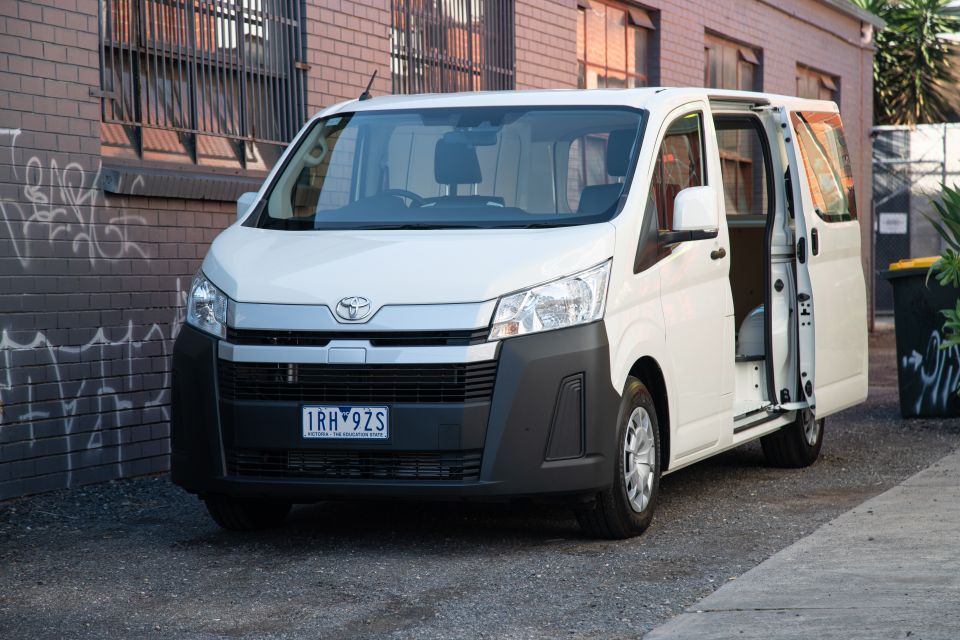
The growth in February came principally from light commercial utes and vans, with that market up 24.3 per cent. SUVs also grew 8.6 per cent. Passenger cars declined 15.3 per cent.
As we saw in January, it was the private buyer market doing the heavy lifting. Private sales leapt 15.8 per cent for the month to 43,429, while business fleet sales fell 4 per cent to 30,865. Government and rental-car sales dipped by double digits.
Toyota’s market share in first sat at 21.9 per cent of the total. It more than doubled the sales of its nearest rival Mazda, which itself recorded strong 15 per cent monthly volume growth.
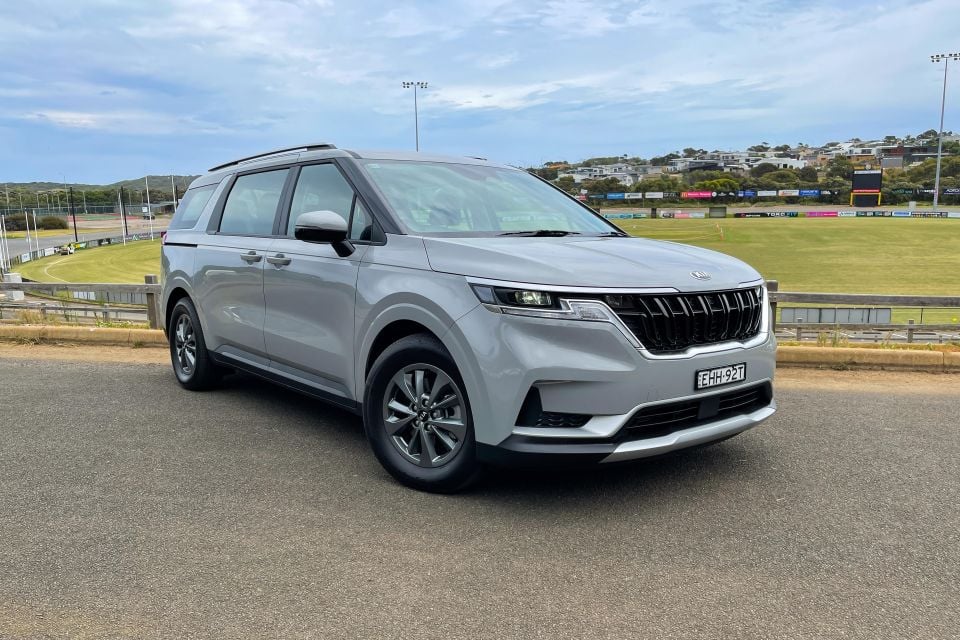
Hyundai grabbed third spot on the podium, edging out a strong Mitsubishi. Kia outmuscled Ford to take fifth, with the Blue Oval brand next, ahead of Nissan.
While VFACTS separate Mercedes-Benz Cars and Vans, I combine them because every other brand is formatted that way. Ergo Mercedes finished eighth.
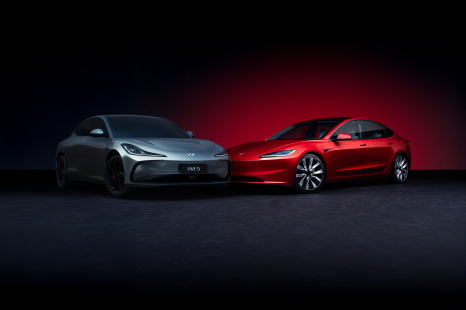
The biggest news is the arrival of China’s MG into the coveted top 10 for the first time. It finished ninth, and grew its sales by almost 160 per cent – a staggering climb up the charts given it finished 17th in February 2020.
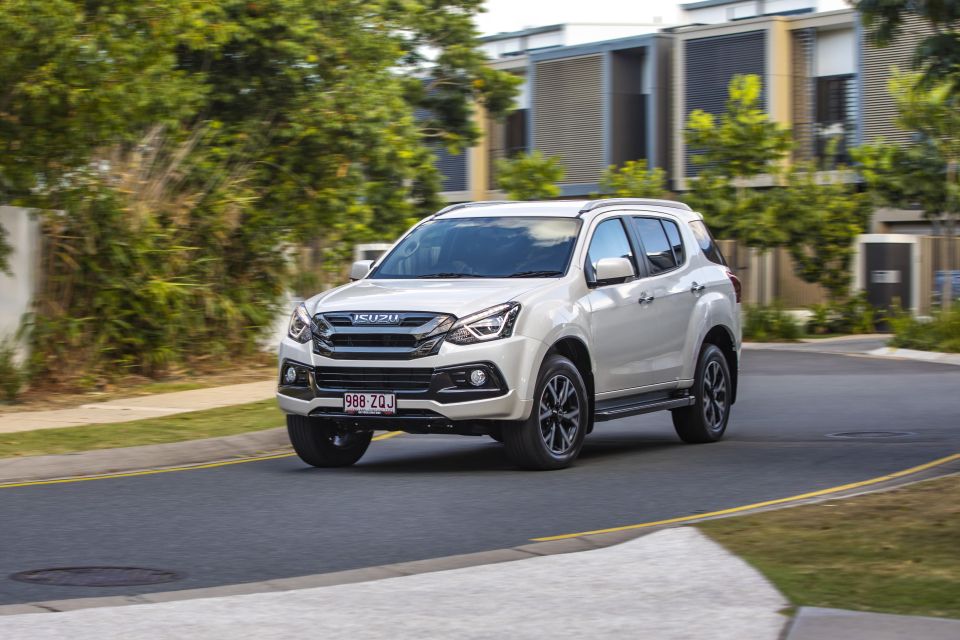
It also edged out the likes of Volkswagen, Subaru, Isuzu Ute (nevertheless up a strong 61 per cent and hindered by short supply), and Honda, which made up the next positions on the chart. Honda had a hard time, plummeting 42.7 per cent.
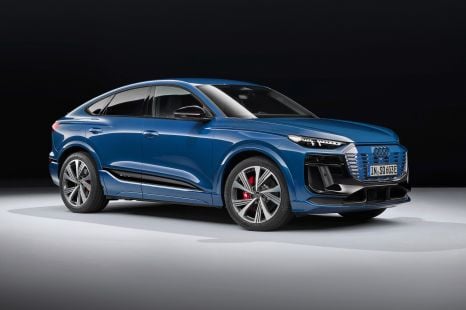
Rounding out the top 20 were BMW, Suzuki, Audi, LDV, GWM (formerly known as Great Wall, sales up 210 per cent), Skoda, and Volvo Car.

Sales by brand, February 2021
| Brand | Sales | Change % |
|---|---|---|
| Toyota | 18,375 | 3.9% |
| Mazda | 8322 | 15.1% |
| Hyundai | 6252 | 5.2% |
| Mitsubishi | 6202 | 12.5% |
| Kia | 5871 | 14.7% |
| Ford | 4712 | -3.0% |
| Nissan | 3824 | 0.5% |
| Mercedes-Benz | 3123 | -2.5% |
| MG | 3017 | 159.4% |
| Volkswagen | 3009 | -17.2% |
| Subaru | 2639 | 1.4% |
| Isuzu Ute | 2510 | 61.0% |
| Honda | 2017 | -42.7% |
| BMW | 1941 | -3.9% |
| Suzuki | 1340 | -5.8% |
| Audi | 1181 | -6.0% |
| LDV | 912 | 64.6% |
| GWM | 868 | 210.0% |
| Skoda | 835 | 41.8% |
| Volvo Car | 822 | 28.6% |
| Lexus | 765 | 1.2% |
| Land Rover | 608 | -11.8% |
| Jeep | 562 | 20.6% |
| Porsche | 391 | 7.1% |
| Ram | 305 | 38.6% |
| Renault | 292 | -26.8% |
| Mini | 277 | 0.7% |
| SsangYong | 193 | 72.3% |
| Peugeot | 117 | -37.4% |
| Fiat | 108 | -8.5% |
| Jaguar | 80 | -49.7% |
| Chevrolet | 77 | NA |
| Maserati | 44 | -25.4% |
| Alfa Romeo | 31 | -55.1% |
| Genesis | 28 | 460.0% |
| Bentley | 20 | 42.9% |
| Chrysler | 16 | -51.5% |
| Ferrari | 13 | -56.7% |
| McLaren | 13 | NA |
| Aston Martin | 11 | 10.0% |
| Lamborghini | 11 | No change |
| Lotus | 10 | 150.0% |
| Citroen | 6 | -75.0% |
| Rolls-Royce | 3 | No change |
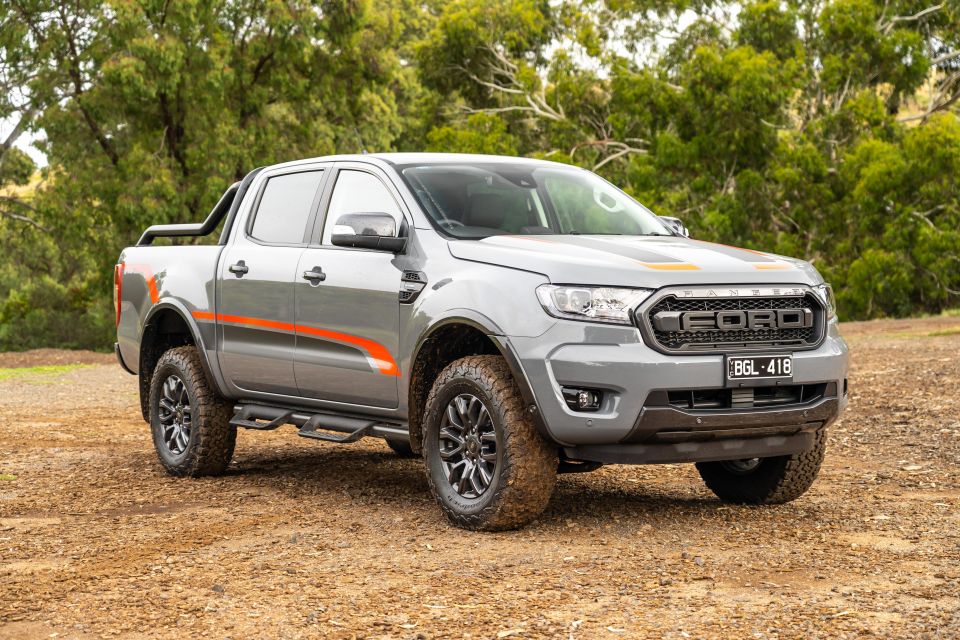
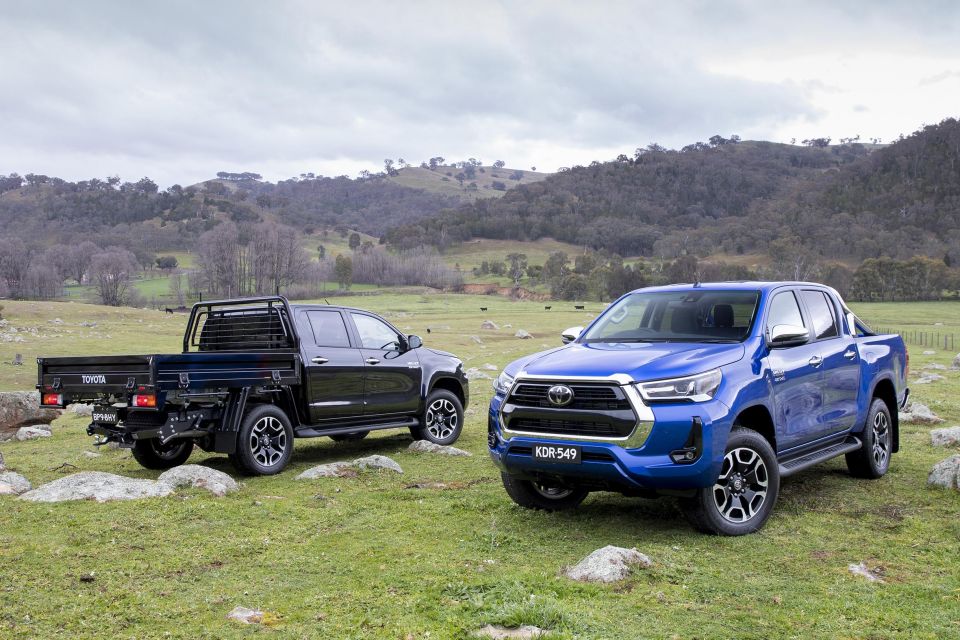
The top 10 models list featured four utes (Toyota HiLux, Ford Ranger, Isuzu D-Max, and Mitsubishi Triton), three SUVs (Toyota RAV4, Mazda CX-5, and Mitsubishi ASX), and three small cars (Toyota Corolla, Hyundai i30, and Kia Cerato).
VFACTS categorises all Toyota LandCruisers (meaning 70 Series and 200 Series) together, but I do not. They’re very different vehicles.
Sales by model, February 2021
| Model | Sales | Change |
|---|---|---|
| Toyota HiLux | 4808 | 40.5% |
| Ford Ranger | 2900 | -9.4% |
| Toyota RAV4 | 2750 | -18.5% |
| Toyota Corolla | 2427 | -3.7% |
| Hyundai i30 | 2210 | 2.7% |
| Mazda CX-5 | 2048 | 4.0% |
| Isuzu D-Max | 1765 | 68.6% |
| Mitsubishi Triton | 1761 | 5.3% |
| Mitsubishi ASX | 1489 | 10.2% |
| Kia Cerato | 1468 | -21.6% |
| Toyota Prado | 1407 | 6.9% |
| Mazda CX-3 | 1379 | 3.1% |
| Mazda 3 | 1373 | -4.3% |
| Toyota LandCruiser wagon | 1326 | 16.0% |
| Hyundai Kona | 1323 | 15.0% |
| MG 3 | 1313 | 111.8% |
| MG ZS | 1302 | 262.7% |
| Toyota LandCruiser ute | 1195 | 71.7% |
| Mazda BT-50 | 1184 | 50.4% |
| Mitsubishi Outlander | 1178 | 4.0% |
| Nissan X-Trail | 1151 | -20.0% |
| Kia Seltos | 1068 | 38.3% |
| Hyundai Tucson | 1062 | -14.4% |
| Nissan Qashqai | 1027 | 5.2% |
| Subaru Forester | 1009 | -3.6% |
We can also identify the most popular models in each vehicle segment, as defined by the FCAI in its VFACTS data.

Sales by fuel type and segment

Top sources of new vehicles
Sales by Australian region
| Region | Sales | Change |
|---|---|---|
| Australian Capital Territory | 1392 | -38.3% |
| New South Wales | 27,302 | 10.8% |
| Northern Territory | 747 | 32.7% |
| Queensland | 18,276 | 14.8% |
| South Australia | 5337 | 4.7% |
| Tasmania | 1339 | -3.9% |
| Victoria | 21,027 | -8.7% |
| Western Australia | 8557 | 21.7% |
“During the past four months we have seen an increase of 10.6% in new vehicles and this has been reflected with strong growth in NSW, Queensland, Western Australia, South Australia and the Northern Territory in February 2021.
“The sales reduction in Victoria can be attributed to the COVID 19 restrictions that were put in place during the month.
“We remain confident that this trend of growth will continue in an environment where business operating conditions continue to normalise.”
Got any questions about car sales? Ask away in the comments and I’ll jump in!
William Stopford
3 Hours Ago
William Stopford
3 Hours Ago

Andrew Maclean
4 Hours Ago

Derek Fung
4 Hours Ago
Andrew Maclean
4 Hours Ago

Ben Zachariah
1 Day Ago