
James Wong
2026 Nissan Ariya review
3 Days Ago
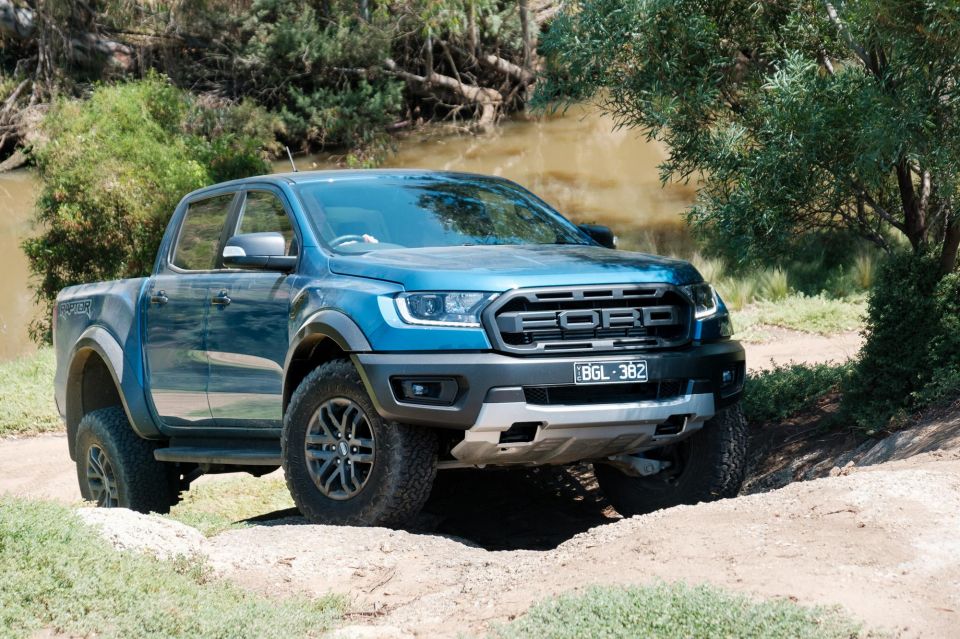
New April record set despite stock shortages, Ford Ranger beats HiLux and tops the charts with more than 5000 sales, four Chinese brands inside the top 20.

Senior Contributor

Senior Contributor
The Australian new vehicle market continues to recover with supply the only obvious constraint, industry VFACTS data shows.
There were 92,347 new vehicles counted as sold last month, up 137.2 per cent over April 2020. This takes the annualised tally to 355,995 units, up almost 31 per cent.
Last month’s sales results were in fact the highest of any April on record, and the sixth consecutive month of market sales growth.
This is not surprising, of course, given this time last year we were living under restrictions designed to curb the spread of COVID-19.
You can remind yourself of the precipitous decline we saw 12 months ago by clicking here.
Every State and Territory saw growth, with population centres New South Wales, Victoria, Queensland, Western Australia, and South Australia all up between 135 per cent and 144 per cent.
Toyota doubled its nearest competitor’s tally with 20,208 sales, about double what it managed last year, thanks in large part to bumper months for the HiLux 4×4, LandCruiser, and RAV4.
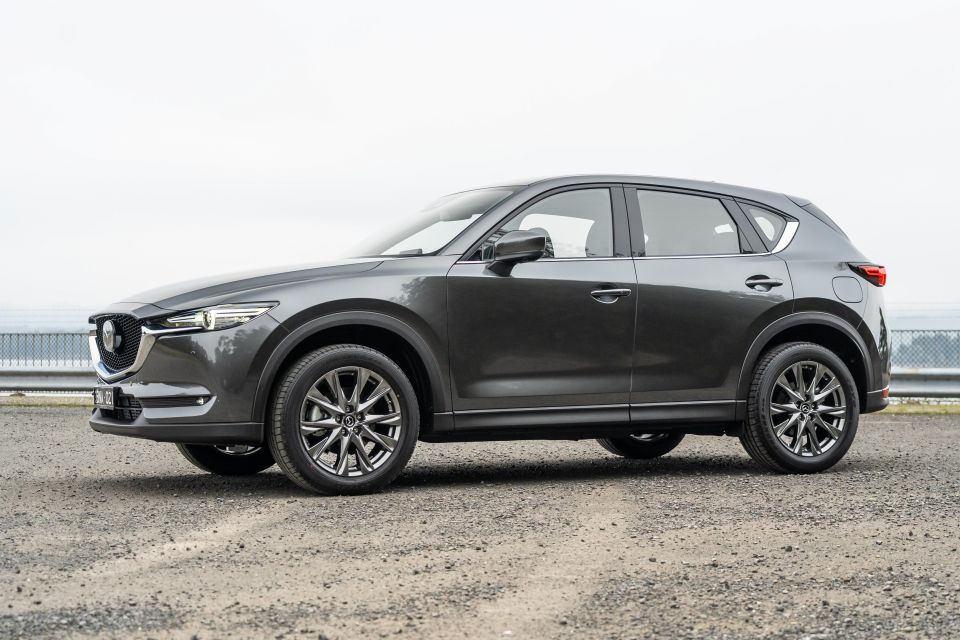
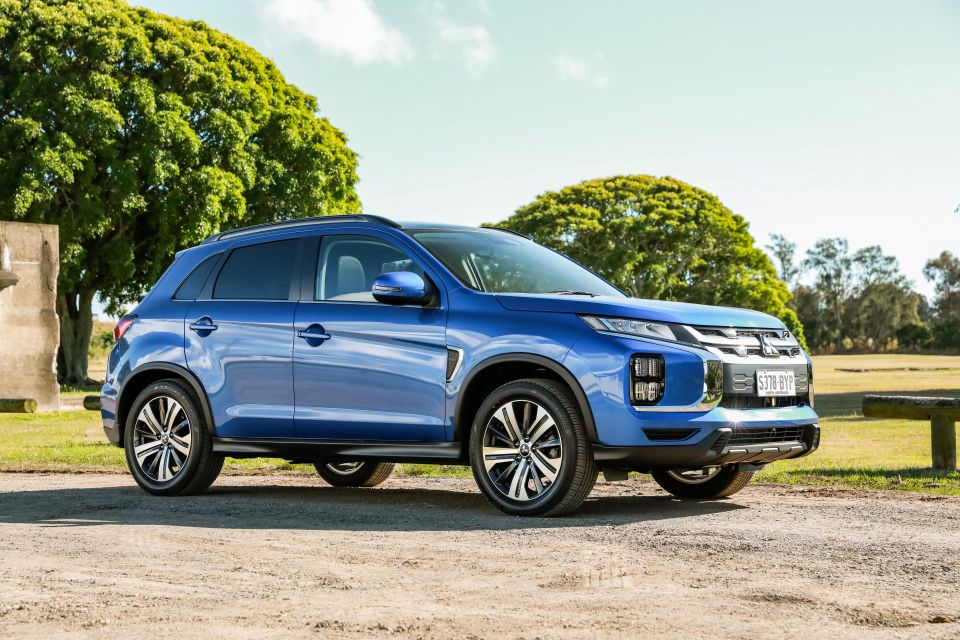
Mazda sales more than tripled thanks in large part to the CX-3 and CX-5, while Mitsubishi in third rebounded in a huge way to grow by 333 per cent thanks mostly to the ASX and Triton.
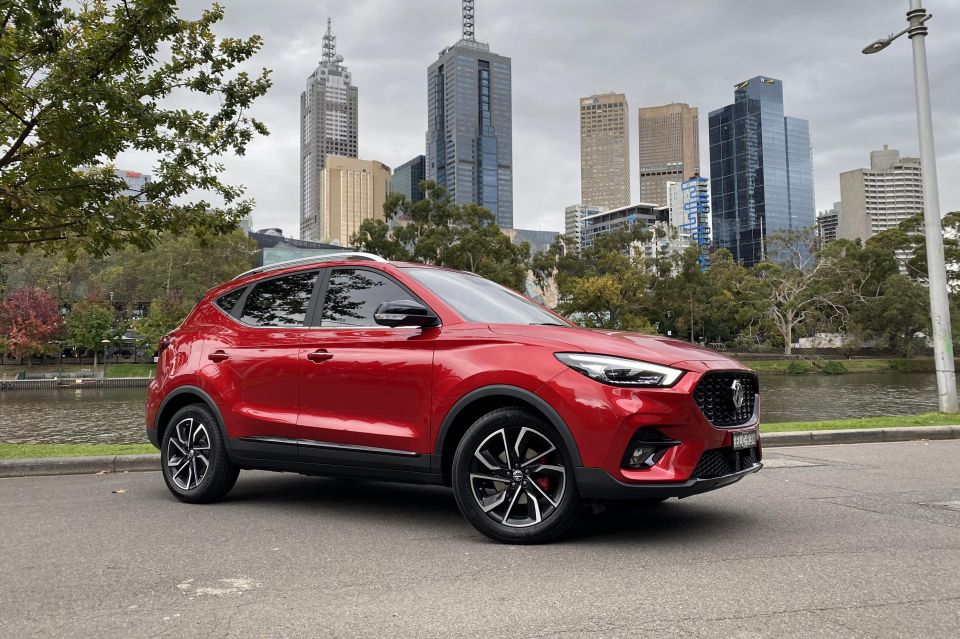
Making up the rest of the top 10 were Ford (up 217.5 per cent), Hyundai (up 156.9 per cent), Kia (up 129 per cent and a whisker off beating its bigger Korean sibling), Nissan (up 138.4 per cent), Subaru (up 169.2 per cent), Volkswagen (up 135.2 per cent), and finally MG (once again in the top 10, up 626.3 per cent!).
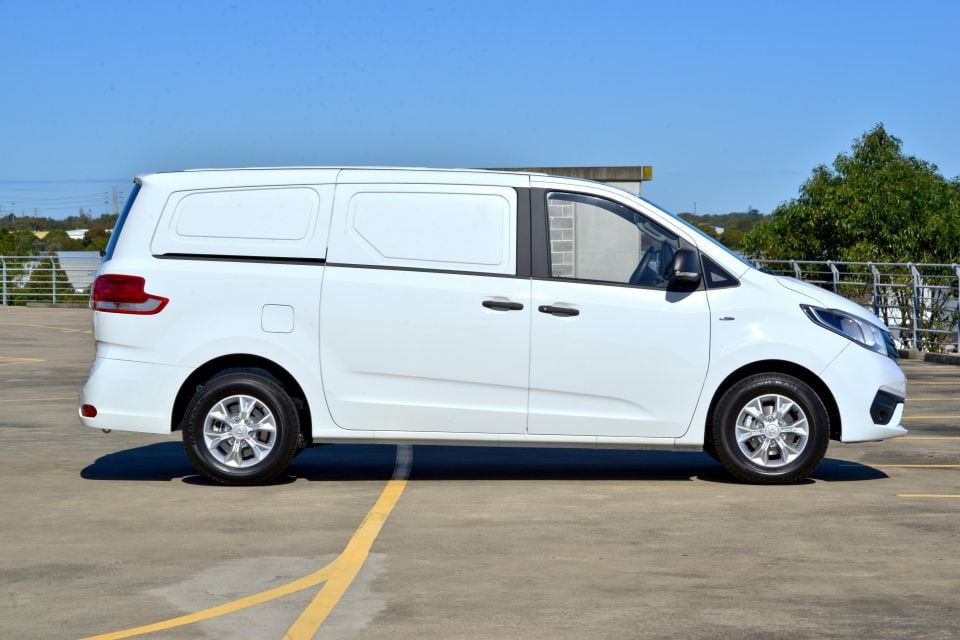
The next tier (11-20) were Isuzu Ute, Mercedes-Benz (including vans and passenger cars), BMW (which beat Mercedes-Benz by two units if you exclude commercial vehicles), Honda, GWM/Haval, Suzuki, Audi, LDV, Skoda, and Lexus.
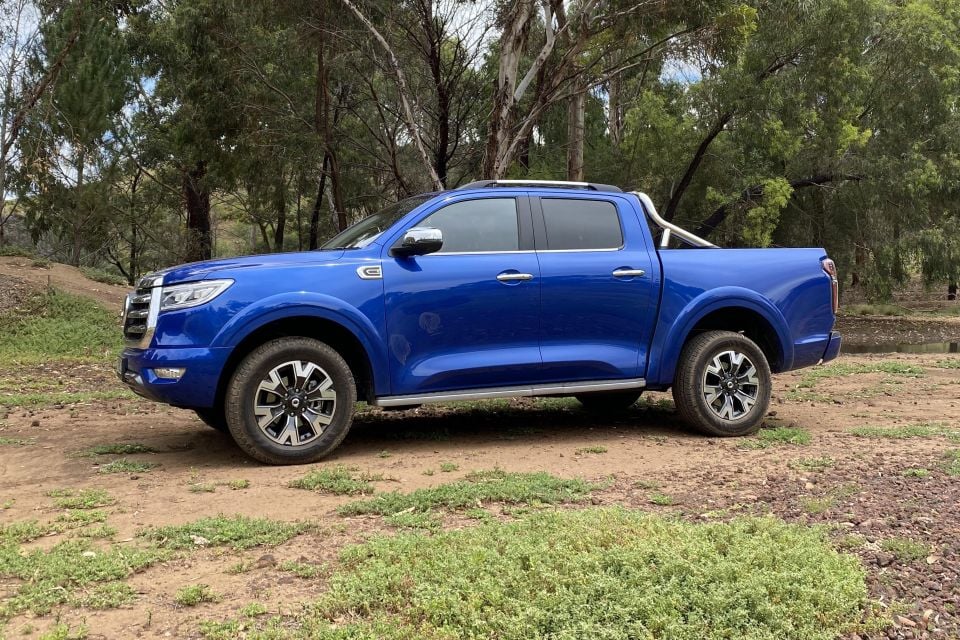
This means that the market’s Chinese brands – MG, LDV, GWM, and Haval – all finished inside the top 20. Sales of cars from China (including certain Volvos) were up more than 600 per cent.
Full list of all brands below:
| Brand | Sales | Growth over April 2020 |
|---|---|---|
| Toyota | 20,208 | 95.7% |
| Mazda | 10,052 | 232.6% |
| Mitsubishi | 7513 | 333.3% |
| Ford | 7146 | 217.5% |
| Hyundai | 5772 | 156.9% |
| Kia | 5707 | 129.0% |
| Nissan | 3500 | 138.4% |
| Subaru | 3451 | 169.2% |
| Volkswagen | 3123 | 135.2% |
| MG | 3007 | 626.3% |
| Isuzu Ute | 2849 | 159.2% |
| Mercedes-Benz | 2584 | 91.4% |
| BMW | 2153 | 26.4% |
| Honda | 1708 | 62.4% |
| GWM | 1337 | 672.8% |
| Suzuki | 1308 | 114.1% |
| Audi | 1281 | 243.4% |
| LDV | 1086 | 417.1% |
| Skoda | 936 | 774.8% |
| Lexus | 909 | 121.2% |
| Volvo Car | 794 | 176.7% |
| Jeep | 655 | 265.9% |
| Land Rover | 645 | 160.1% |
| Porsche | 354 | 55.9% |
| Renault | 298 | -4.2% |
| Mini | 276 | 80.4% |
| Ram | 250 | 40.4% |
| SsangYong | 215 | 298.1% |
| Peugeot | 189 | 166.2% |
| Fiat | 133 | 87.3% |
| Chevrolet | 111 | NA |
| Jaguar | 94 | 49.2% |
| Alfa Romeo | 50 | 284.6% |
| Maserati | 47 | 95.8% |
| Genesis | 31 | 342.9% |
| Ferrari | 23 | 155.6% |
| Lamborghini | 18 | 100.0% |
| Bentley | 12 | 200.0% |
| Aston Martin | 9 | 800.0% |
| McLaren | 7 | NA |
| Chrysler | 6 | -62.5% |
| Lotus | 6 | 500.0% |
| Rolls-Royce | 5 | 400.0% |
| Citroen | 3 | -50.0% |
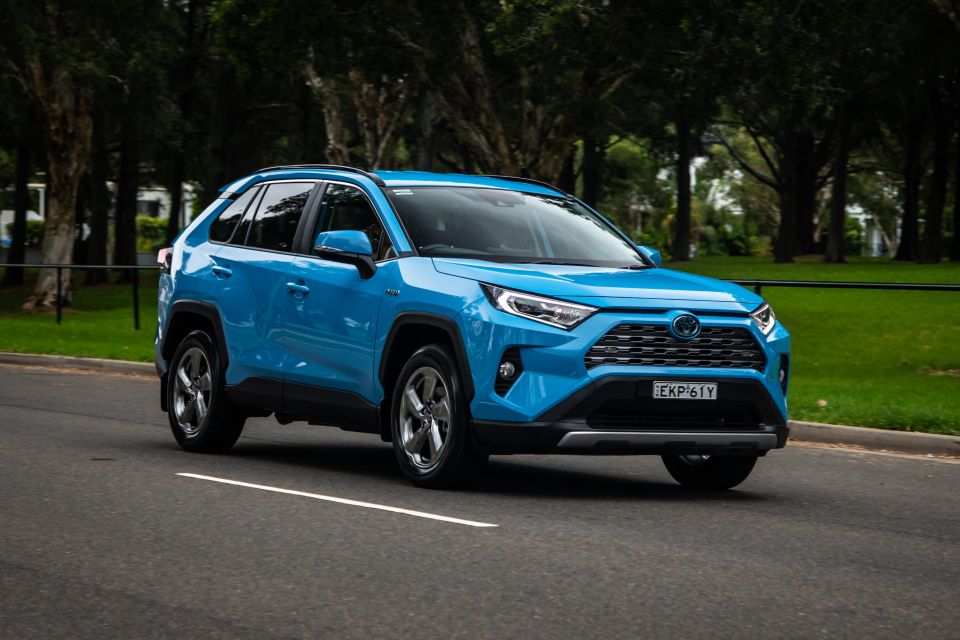
The Ford Ranger took all before it with more than 5000 monthly sales, while its HiLux rival (4222) was relegated into third behind its Toyota RAV4 stablemate (4506).
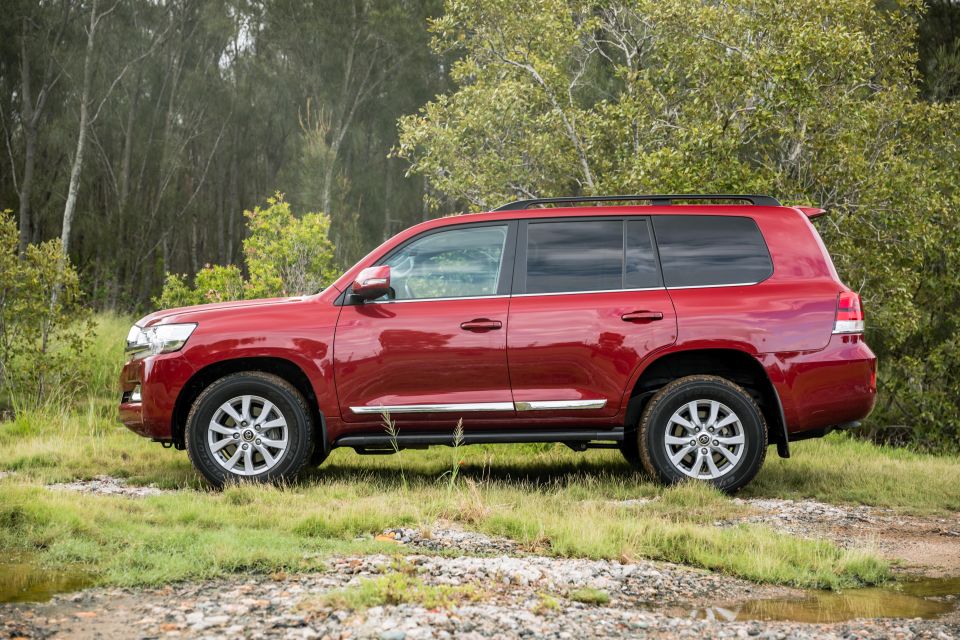
Next was the venerable Mitsubishi Triton, ahead of the Toyota LandCruiser 70- and 200-Series wagon family. Stock of the 200 Series is getting thin on the ground but demand ain’t slowing as the 300 Series’s premiere nears…
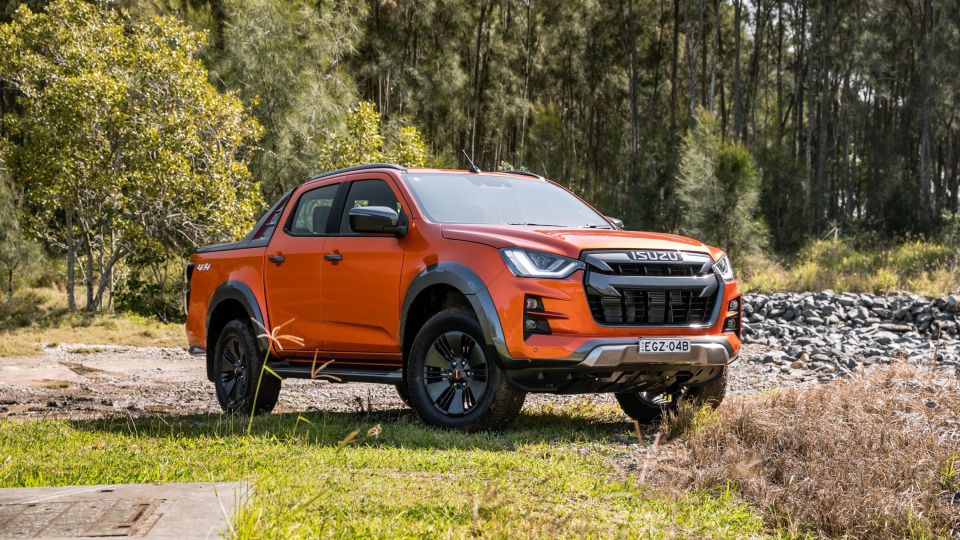
Rounding out the top 10 were the Mazda CX-5, Toyota Corolla, Mitsubishi ASX, Hyundai i30, and Isuzu D-Max.
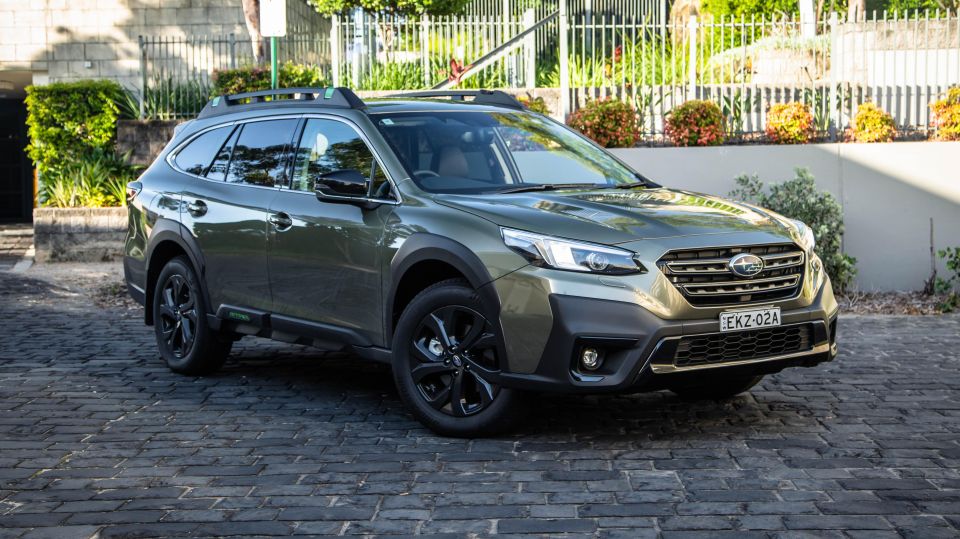
If we take the 25 best-selling vehicles in the market, we find they made up about 53 per cent of the total pie for April. The make-up of this list comprised 13 SUVs, and six each of light commercial utes and passenger cars.
| Model | Sales | Growth |
|---|---|---|
| Ford Ranger | 5021 | 226.0% |
| Toyota RAV4 | 4506 | 135.8% |
| Toyota HiLux | 4222 | 80.5% |
| Mitsubishi Triton | 2458 | 424.0% |
| Toyota LandCruiser wagon | 2595 | 180.8% |
| Mazda CX-5 | 2353 | 263.1% |
| Toyota Corolla | 2073 | 73.5% |
| Mitsubishi ASX | 2028 | 482.8% |
| Hyundai i30 | 2005 | 188.5% |
| Isuzu D-Max | 1999 | 163.0% |
| Mazda CX-3 | 1779 | 351.5% |
| Hyundai Kona | 1529 | 303.4% |
| Kia Cerato | 1527 | 77.6% |
| Nissan X-Trail | 1522 | 224.5% |
| Mazda BT-50 | 1443 | 209.7% |
| Toyota Prado | 1370 | 44.7% |
| MG ZS | 1350 | >999% |
| Mitsubishi Outlander | 1342 | 192.4% |
| Subaru Forester | 1327 | 160.2% |
| Toyota Camry | 1197 | 77.3% |
| MG 3 | 1150 | 418.0% |
| Mazda 3 | 1072 | 134.1% |
| Nissan Navara | 1072 | 106.6% |
| Subaru Outback | 1041 | 309.8% |
| Mazda CX-30 | 1035 | 129.0% |
We can also identify the most popular models in each vehicle segment, as defined by industry VFACTS data.

Category breakdown:
Top segments by market share:

Sales by buyer type:
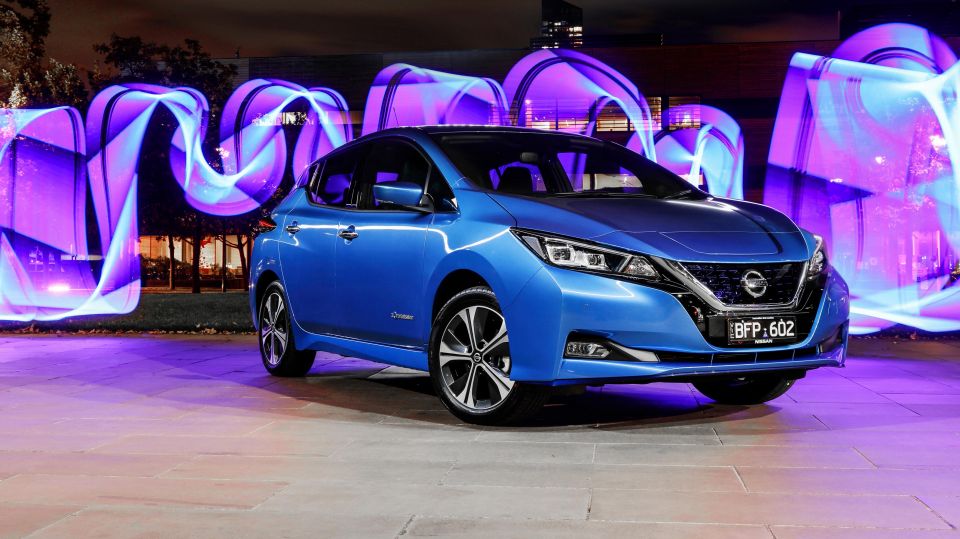
Sales by propulsion or fuel type:
* Tesla refuses to supply sales information
Sales by country of origin:
“New vehicles sales are a direct reflection of the performance of the broader economy in terms of consumer and business confidence,” said Federal Chamber of Automotive Industries chief executive Tony Weber.
“This time last year we were seeing significant impacts from COVID-19 with less customer activity and inquiries to dealerships.
“Historically the April result is between 70,000 and 80,000 vehicles, so the 2021 result is very significant. This sales trend is expected to continue as we enter the final two months of the financial year.
“It also was pleasing to see increases in sales for rental vehicles across all segments. Growth in rental fleets will be an important building block supporting the recovery of the tourism industry across the country.”
Mr Weber added that supply chain constraints such as a shortage of semiconductors and shipping issues related to delays through the Suez Canal were impacting the delivery of new vehicles to Australian customers.
“Every vehicle company is focused on solving the issues caused by these impacts and they are working with customers to keep them fully informed regarding supply issues and delivery dates.
“It is possible there is pent-up market demand which may be reflected in sales figures in the second half of 2021 as solutions are found to these issues.”
Got any questions about car sales? Ask away in the comments and I’ll jump in!


James Wong
3 Days Ago

William Stopford
3 Days Ago

Josh Nevett
2 Days Ago


Paul Maric
1 Day Ago

Ben Zachariah
17 Hours Ago

William Stopford
17 Hours Ago