
Max Davies
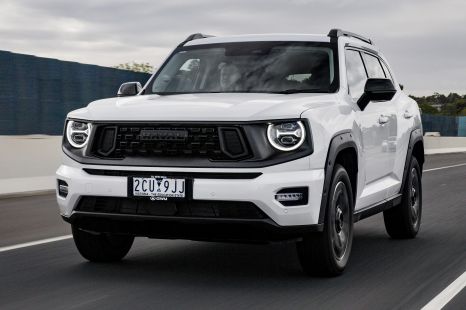
2025 GWM Haval H7 review
GWM's newest model in Australia looks unique, but it's a miss in the brand's ever-improving local SUV lineup.
5 Days Ago
Chip crunch sees sales tumble in October, Toyota king but Ranger closes on HiLux, Chinese brands boom, Honda goes backwards again.

Senior Contributor
Senior Contributor
Enduring global supply chain woes are now being reflected on the Aussie VFACTS charts, which recorded a paltry 74,650 sales in October – the lowest tally for this month since 2002.
Disastrously for the nation’s car brands and dealers, that’s despite strong demand which by most accounts is rushing back as people and business defrost after restrictions.
The October tally was down 8.1 per cent on the same month last year.
Supplier of VFACTS data, the Federal Chamber of Automotive Industries, reaffirmed to CarExpert today that the numbers are cross-checked against registrations. That’s an important point we’ll explain in a bit.

All that said, the total market will probably still sneak over the million annual sales mark – a tally achieved every year since 2009 – with the sole exception of 2020.
The YTD sales of new vehicles in Australia sit at 890,790 to the end of October, up a healthy 22.7 per cent.
FCAI Chief Executive Tony Weber said it was clear manufacturers were having challenges with supply chains.
“Automotive manufacturers, like all those in the global manufacturing sector, are dealing with a microprocessor shortage which is leading to longer wait times to get products to market. Australians are continuing to purchase vehicles and car makers are working to deliver products to our shores,” Mr Weber said.
Semiconductor shortages – these chips are complicated to make and cars use lots of them – are costing brands millions of sales all over the globe, slowing factories, and causing months-long wait lists on many of Australia’s most popular vehicles.
This is in turn driving used-car prices to record highs.
MORE: Stock shortages, production cuts all over as chip crunch hits MORE: Staggering impact of semiconductor shortage on car industry revealed
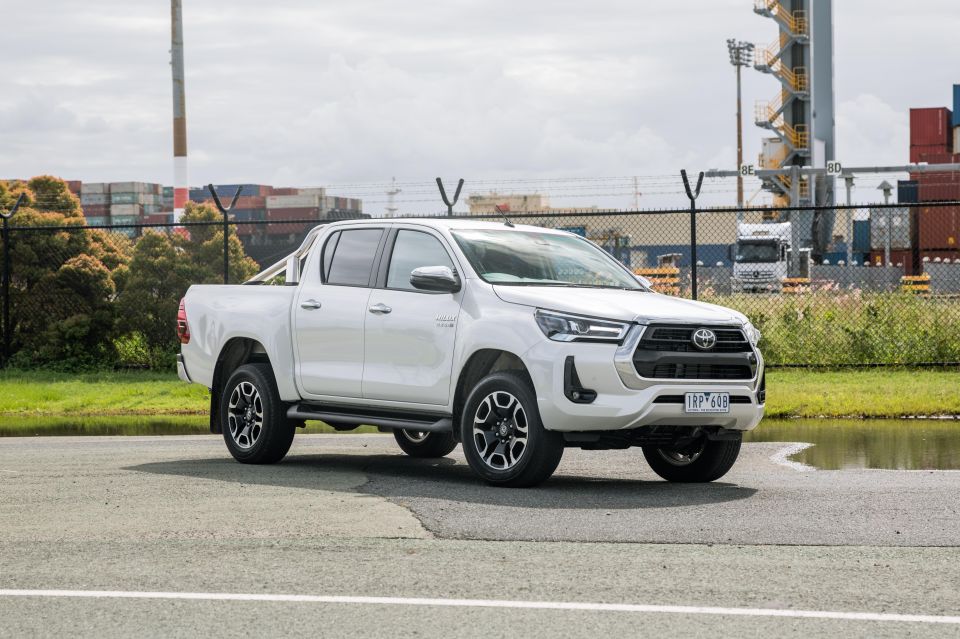
Despite well-publicised supply issues capped by a formal apology, Toyota was still dominant with 15,395 sales (down 21.1 per cent) and 20.6 per cent market share.
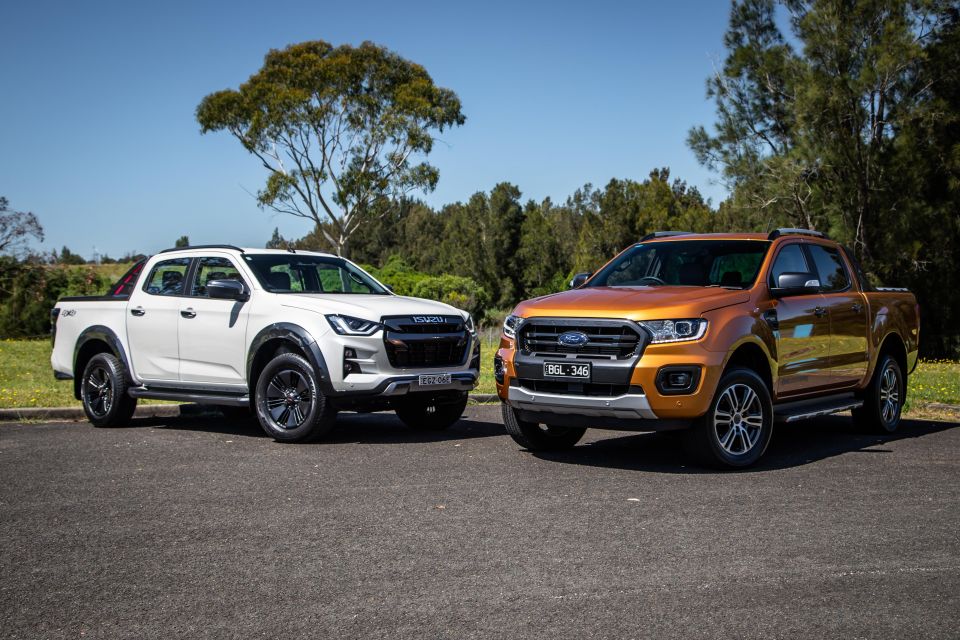
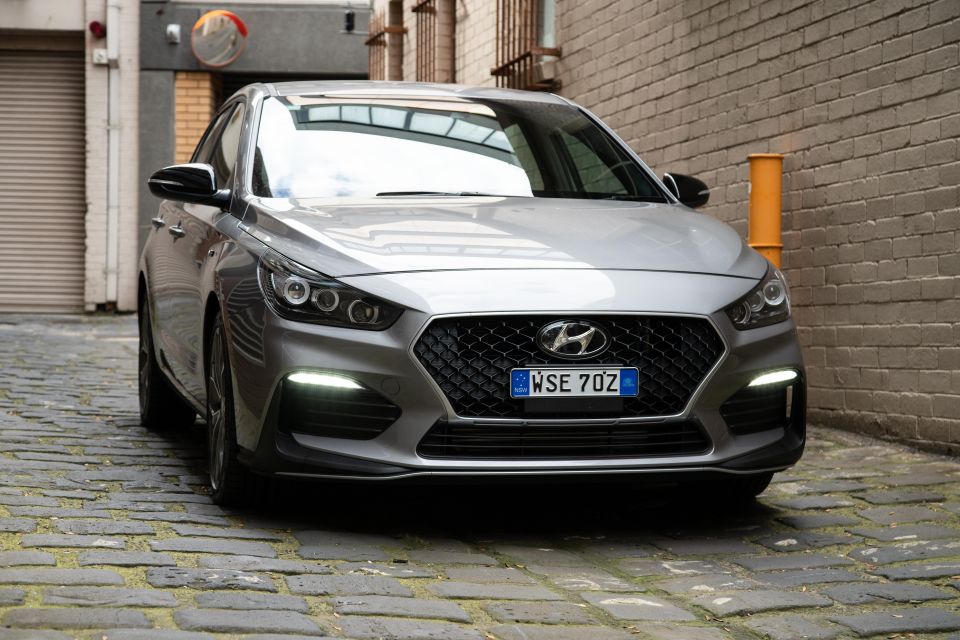
Hyundai actually grew its sales (6115, up 2.8 per cent) for the month and leapt into second, ahead of Ford in third position (5462 sales, down 4.9 per cent and counting some 75 per cent cent of its sales as Rangers).
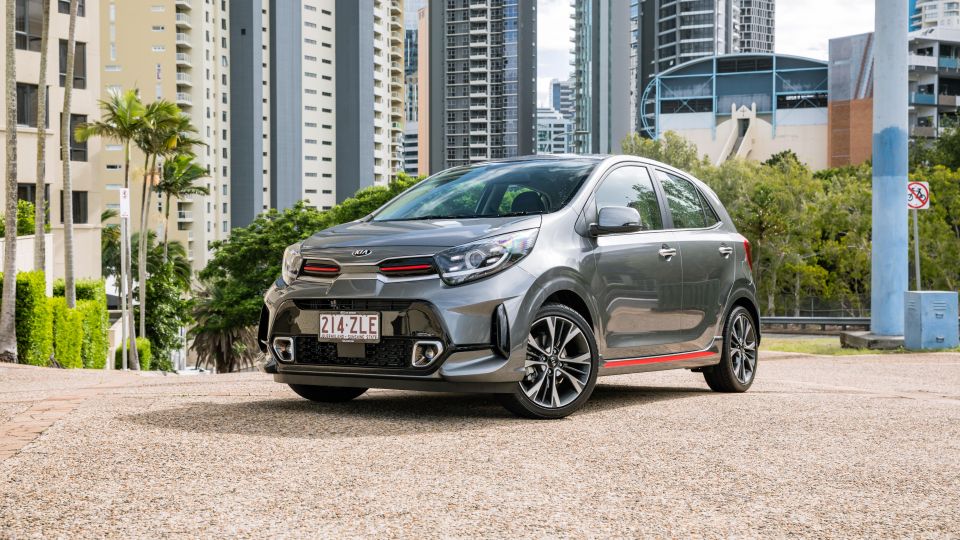
Mazda (5181, down 30.5 per cent on the back of CX-3, CX-5 and CX-9 shortfalls) edged out Kia into fifth (4853, down 8.5 per cent, with Seltos its biggest supply victim by sales).
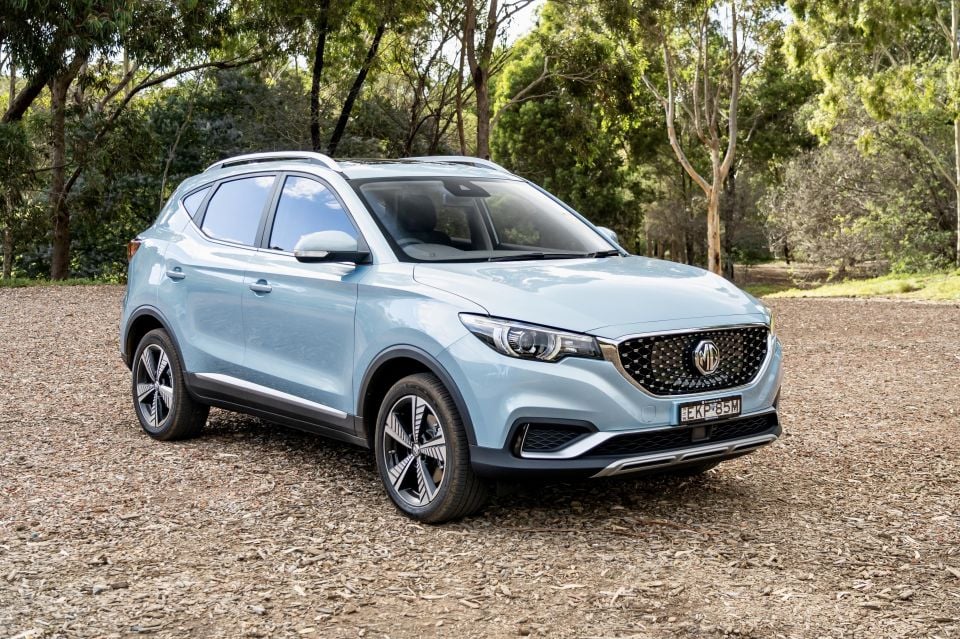
Mitsubishi (4203, down 6.8 per cent) and Nissan (3397, down 4,0 per cent) were sixth and seventh, ahead of ever-expanding MG (3136 sales, up 86.7 per cent thanks to healthy supply) in eighth.
Rounding out the top 10 were Volkswagen (2912, down 6.4 per cent) and Subaru (2736, down 5.7 per cent), relegating Mercedes-Benz (2486 sales, down 15.2 per cent) and Isuzu Ute (2365, still up 5.0 per cent despite supply lags) to 11th and 12th.
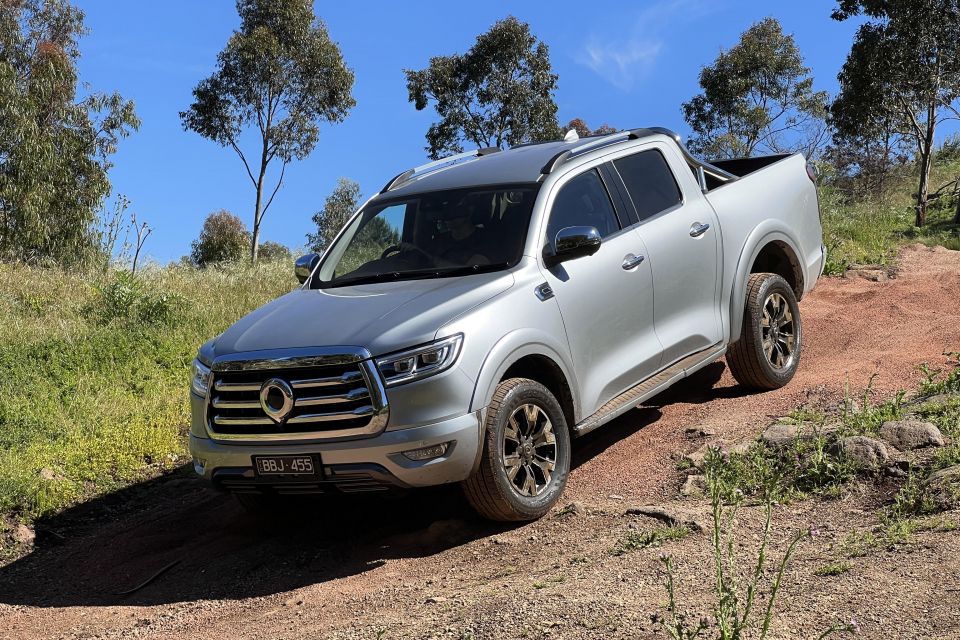
Brands that bucked the trend outside the top dozen included GWM inclusive of Haval (14th spot on the charts with 1692 sales, up some 304.8 per cent) and SsangYong (327 sales, up 93.5 per cent). Fiat also had a ripper (up 72.5 per cent) while Genesis grew its sales from 4 to 61.
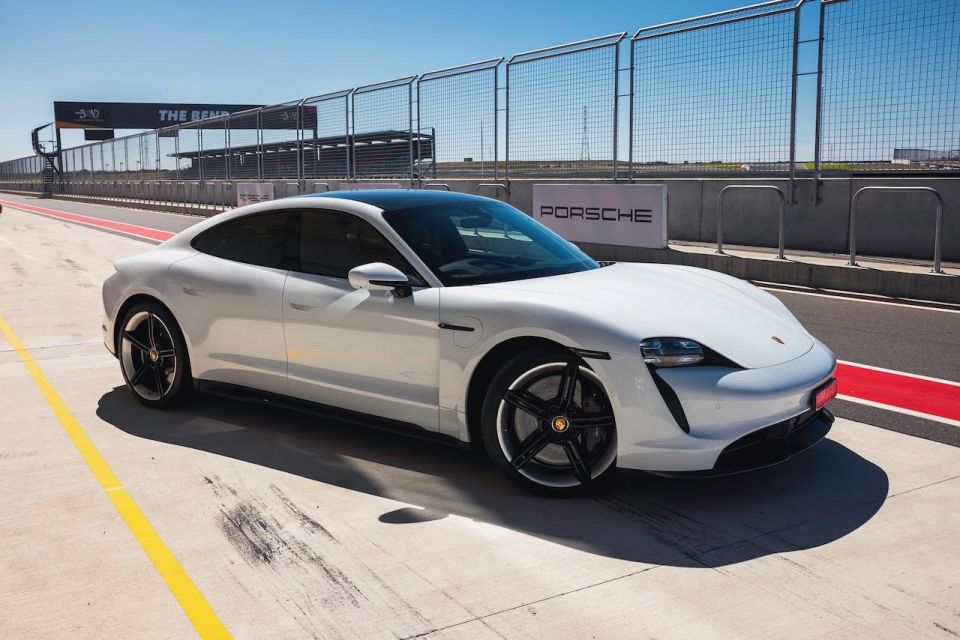
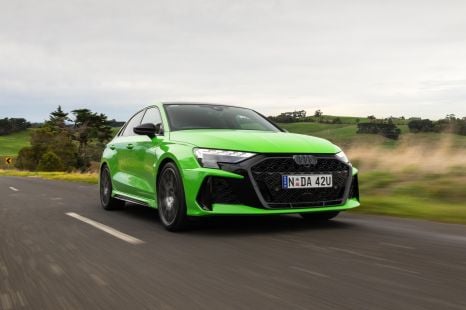
Brands that performed below the market average included Honda (1100 sales, down 45.9 per cent in month four of its new ‘agency’ business model). The likes of Renault, Skoda, Porsche, Mini, Audi and Suzuki all fell between 20 and 30 per cent.
| Brand | Oct 2021 sales | +/- Oct 2020 |
|---|---|---|
| Toyota | 15,395 | -21.1% |
| Hyundai | 6115 | 2.8% |
| Ford | 5462 | -4.9% |
| Mazda | 5181 | -30.5% |
| Kia | 4853 | -8.5% |
| Mitsubishi | 4203 | -6.8% |
| Nissan | 3397 | -4.0% |
| MG | 3136 | 86.7% |
| Volkswagen | 2912 | -6.4% |
| Subaru | 2736 | -5.7% |
| Mercedes-Benz | 2486 | -15.2% |
| Isuzu Ute | 2365 | 5.0% |
| BMW | 1901 | 3.1% |
| GWM | 1692 | 304.8% |
| LDV | 1229 | 10.0% |
| Suzuki | 1118 | -22.7% |
| Audi | 1102 | -25.6% |
| Honda | 1100 | -45.9% |
| Lexus | 633 | -2.5% |
| Volvo Car | 593 | -15.6% |
| Renault | 556 | -29.9% |
| Jeep | 500 | -9.6% |
| Skoda | 453 | -29.4% |
| Land Rover | 337 | -12.0% |
| SsangYong | 327 | 93.5% |
| Ram | 317 | 8.2% |
| Fiat | 257 | 72.5% |
| Peugeot | 246 | 1.7% |
| Porsche | 241 | -29.3% |
| Mini | 193 | -27.7% |
| Chevrolet | 189 | – |
| Jaguar | 64 | -3.0% |
| Genesis | 61 | >999% |
| Maserati | 48 | 118.2% |
| Alfa Romeo | 33 | -56.0% |
| Citroen | 17 | 30.8% |
| Bentley | 14 | 250.0% |
| Chrysler | 13 | 160.0% |
| Ferrari | 12 | -45.5% |
| Aston Martin | 11 | 83.3% |
| Alpine | 9 | – |
| Lamborghini | 9 | -35.7% |
| McLaren | 8 | 60.0% |
| Rolls-Royce | 4 | 33.3% |
| Lotus | 3 | -25.0% |
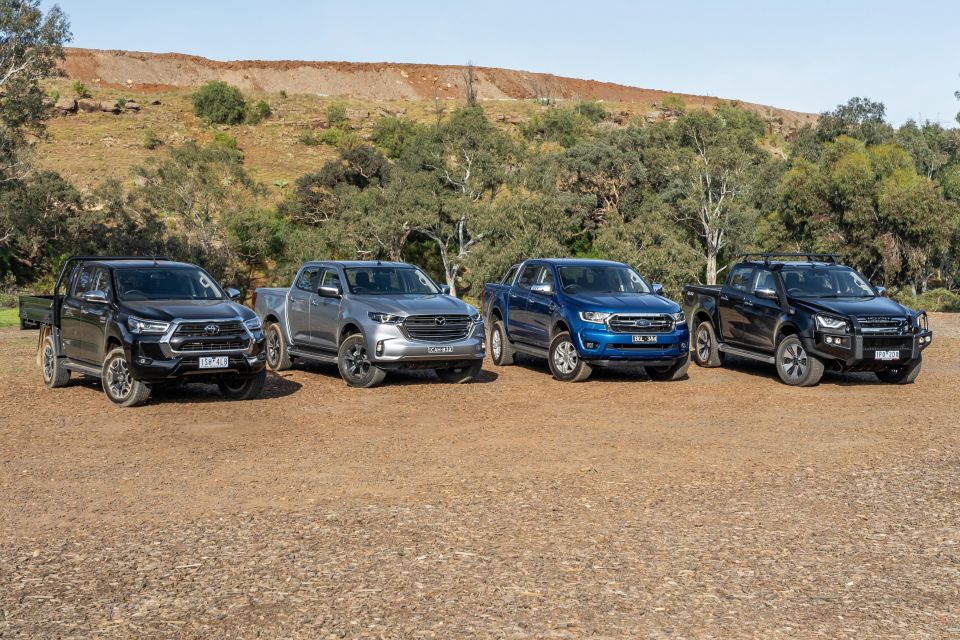
The Ford Ranger and Toyota HiLux romped it in once again, with the Blue Oval gaining the upper hand and edging closer YTD (HiLux 44,752 versus Ranger 41,686). The Isuzu D-Max finishing fifth meant three of the top five vehicles were utes.
The overall segment breakdown of the top 20 models as listed below comprises six utes, three each classified as small cars, small SUVs, medium SUVs and large SUVs, one light car and one van.
Toyota made seven of the top 20 models, ahead of Hyundai with three, and both MG and Nissan with two.
| Model | Oct 2021 sales | % +/- |
|---|---|---|
| Ford Ranger | 4,135 | -1.9% |
| Toyota HiLux | 3961 | -10.9% |
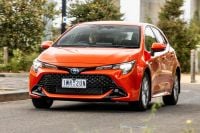
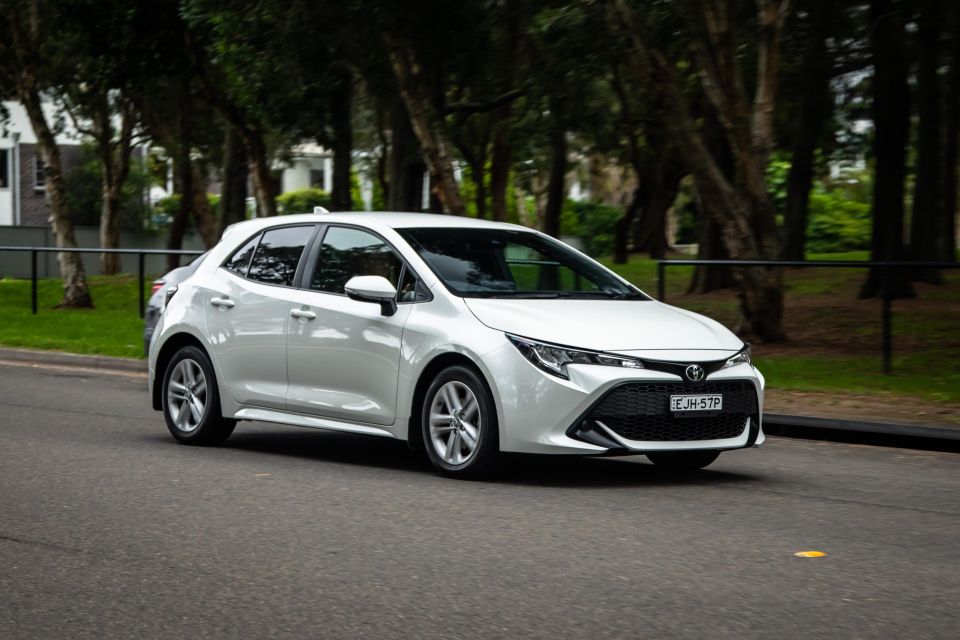
| Toyota Corolla | 1989 | 2.4% |
| Hyundai i30 | 1946 | 36.0% |
| Isuzu D-Max | 1694 | -12.3% |
| Toyota RAV4 | 1670 | -59.1% |
| Hyundai Tucson | 1532 | -8.7% |
| Mitsubishi ASX | 1464 | 30.8% |
| Nissan X-Trail | 1420 | 10.7% |
| Kia Cerato | 1381 | -14.7% |
| Nissan Navara | 1364 | 30.7% |
| Toyota LandCruiser PU/CC | 1348 | 70.8% |
| Toyota Kluger | 1275 | 158.6% |
| MG 3 | 1269 | 45.5% |
| Subaru Outback | 1236 | 138.6% |
| Mazda BT-50 | 1187 | 164.4% |
| MG ZS | 1127 | 111.0% |
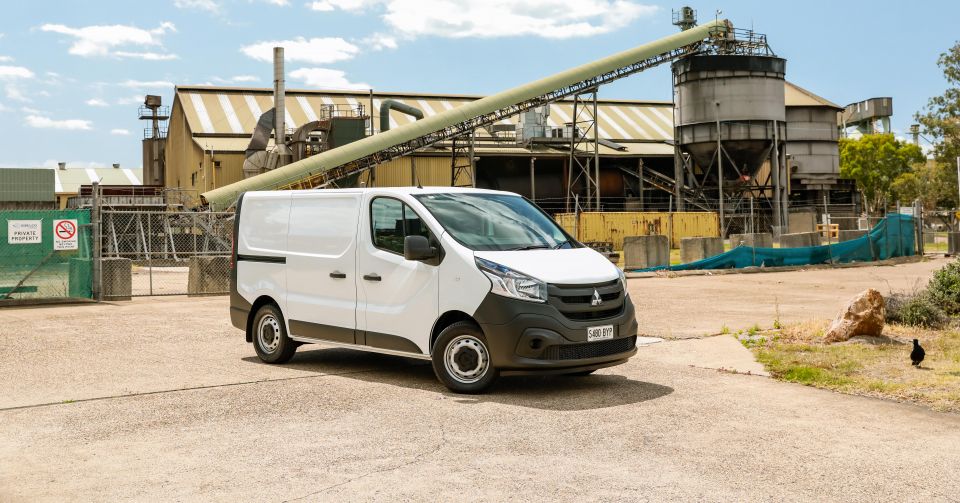
| Toyota HiAce | 1113 | -10.2% |
| Toyota Prado | 1051 | -52.4% |
| Hyundai Kona | 1007 | -10.9% |
We can also identify the most popular models in each vehicle segment.
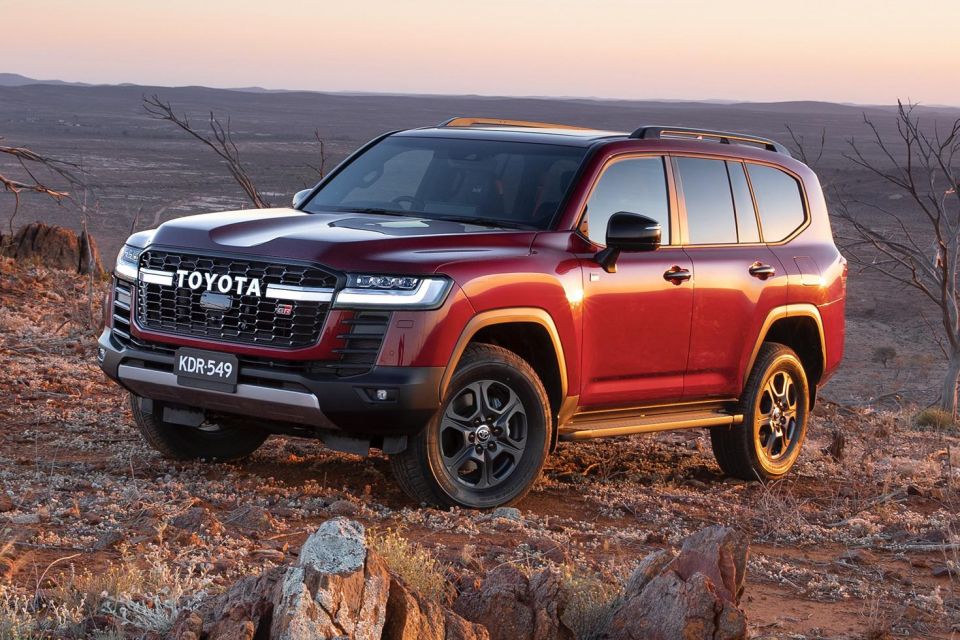
*This number comprises demonstrator versions of the new 300 Series used for test drives, plus the 70 Series five-doors. Which explains the sales despite well-publicised stock freezes on the LC300.
Sales by region
Category breakdown
Top segments by market share
Sales by buyer type
Sales by propulsion or fuel type
* Tesla refuses to supply sales information
Sales by country of origin
| Jan-Oct of | Sales |
|---|---|
| 2021 | 74,650 |
| 2020 | 81,220 |
| 2019 | 82,456 |
| 2018 | 90,718 |
| 2017 | 95,763 |
| 2016 | 93,357 |
| 2015 | 94,321 |
| 2014 | 91,235 |
| 2013 | 92,603 |
| 2012 | 95,584 |
| 2011 | 85,196 |
| 2010 | 80,925 |
| 2009 | 80,813 |
| 2008 | 79,105 |
| 2007 | 89,289 |
| 2006 | 79,930 |
| 2005 | 76,118 |
| 2004 | 81,667 |
| 2003 | 79,225 |
| 2002 | 72,332 |
Got any questions about car sales? Ask away in the comments and I’ll jump in!
Max Davies
5 Days Ago

Josh Nevett
5 Days Ago
Josh Nevett
4 Days Ago

Paul Maric
3 Days Ago

Anthony Crawford
2 Days Ago

Derek Fung
2 Days Ago