
Matt Campbell
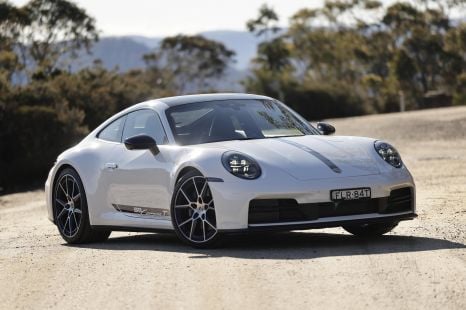
2025 Porsche 911 Carrera T review
The Porsche 911 Carrera T is the slowest version of the German brand's facelifted 992.2 sports car range, but does that really matter?
6 Days Ago
More than 1.2 million new vehicles were sold last year for the first time, as supply improves, but expect the market to cool in 2024.

Senior Contributor
Senior Contributor
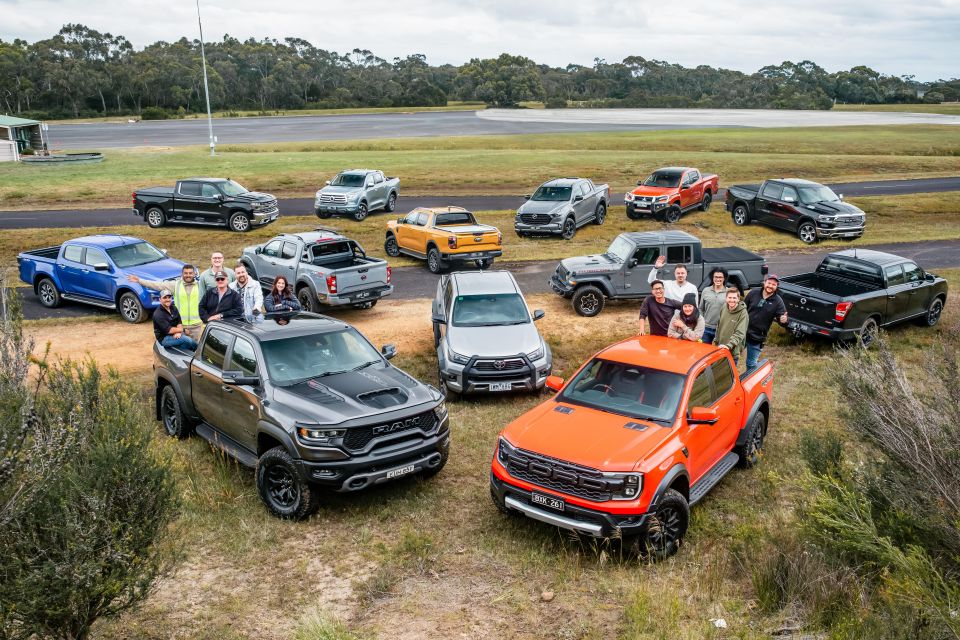
It’s official: the Australian new vehicle market yielded an all-time annual sales record in 2023 as it recovered from years of stock shortages, passing 1.2 million units for the first time.
A grand total of 1,216,780 new passenger and commercial vehicles were counted as sold in 2023, up 12.5 per cent year-over-year, besting the previous all-time record of 1,189,116 from 2017.
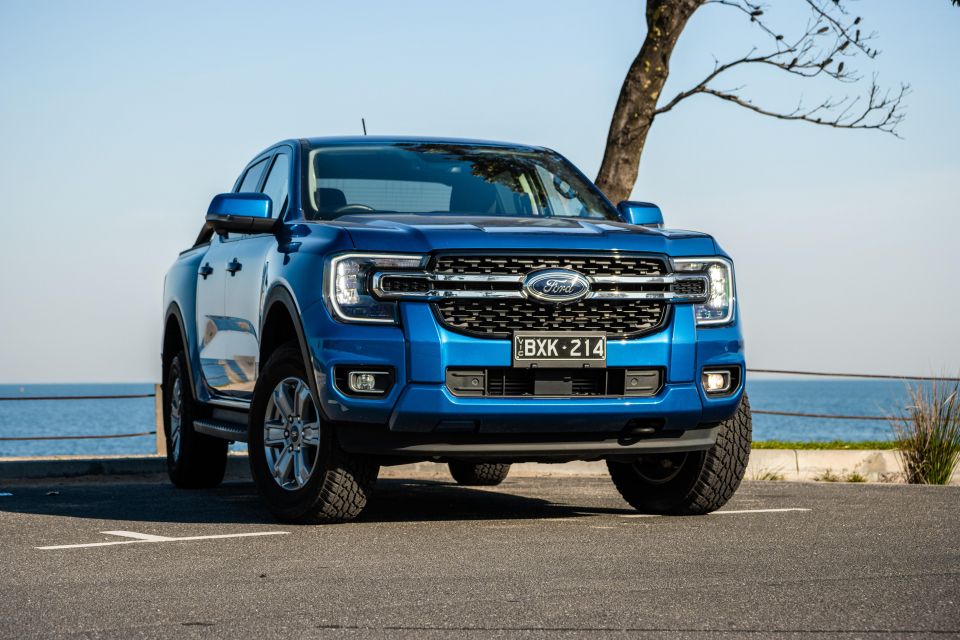
We also have a new sales champion on our hands, with the Australian-developed Ford Ranger storming home to pass the Toyota HiLux near the finishing line – ending a seven-year unbroken run from the Toyota.
There were also a few other unusual results at the pointy end of the charts, with Kia toppling ‘big brother’ Hyundai for the second straight year; and brands like Tesla, MG and Isuzu Ute sitting in the top 10 list.
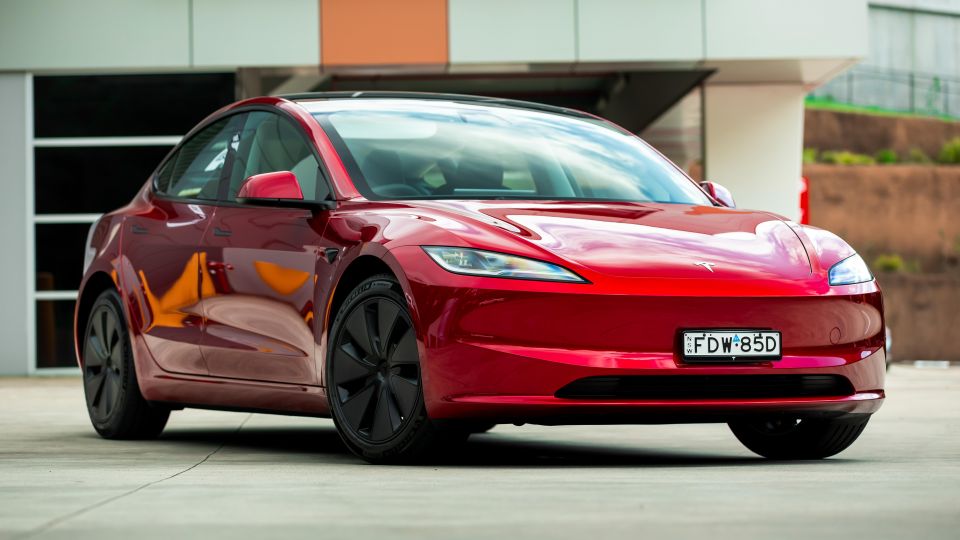
Battery EVs took 7.2 per cent market share, nearly three times what they had in 2022, and if you add hybrids the share of sales for electrified vehicles jumped to 16.2 per cent.
There are, however, signs that 2024 will produce a leaner result as cost-of-living pressures mount and COVID-era waiting lists dissipate. Forward-orders in the dealer network aren’t as strong as they have been previously.
“As we celebrate this historic achievement, we recognise that the automotive sector will face challenges in the coming months. Cost-of-living pressures and increased interest rates will impact the market, and we anticipate a challenging 2024,” conceded Federal Chamber of Automotive Industries (FCAI) chief Tony Weber.
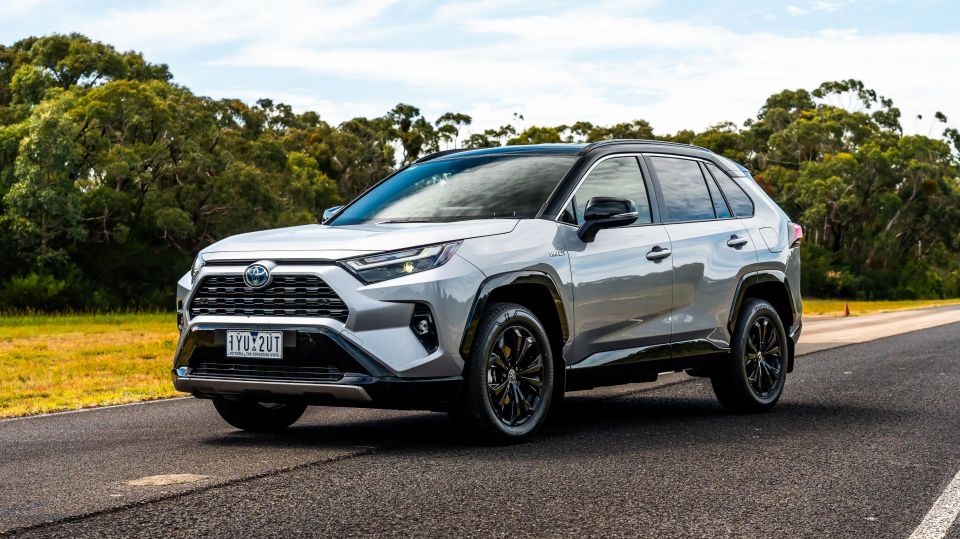
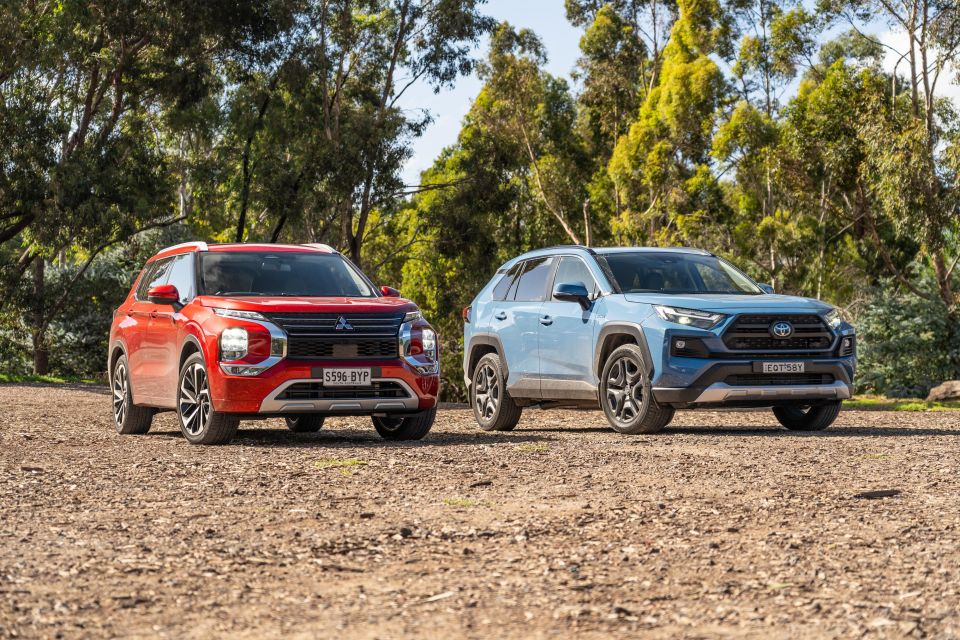
Toyota sat top of the charts as per usual, though ongoing shortages on key models such as Camry, RAV4 and LandCruiser meant it failed to break even with 2022, dropping 6.8 per cent. Its overall market share of 17.7 per cent was well below the 20 per cent benchmark which it typically owns.
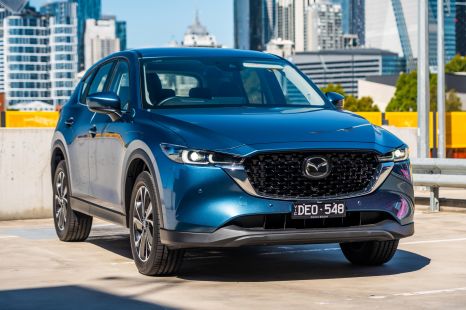
Perennial silver medallist Mazda broke through six figures again thanks to 4.5 per cent annual growth, while Ford stormed into third place on the back of a 31.8 per cent spike in sales due to big growth from Ranger 4×4 (up 35.1 per cent) and Everest (up 46.1 per cent).
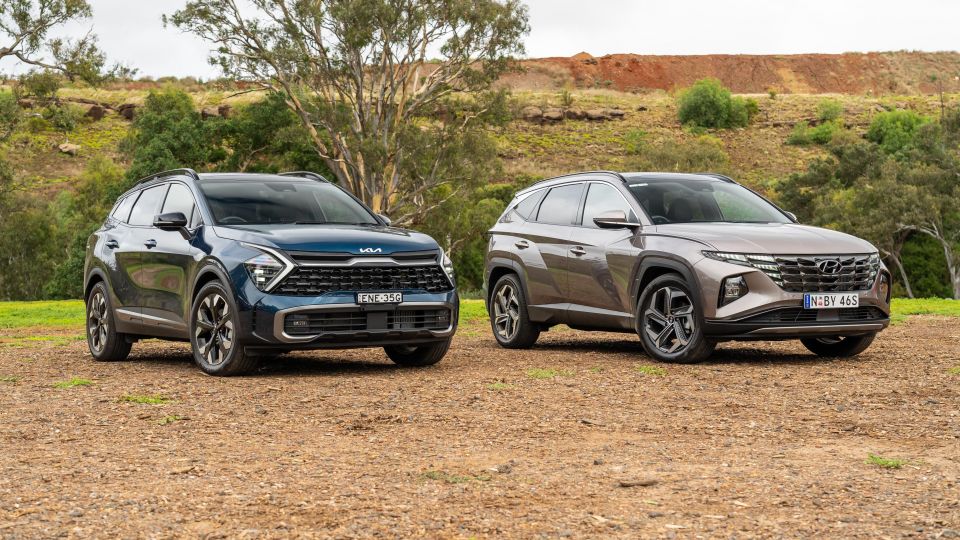
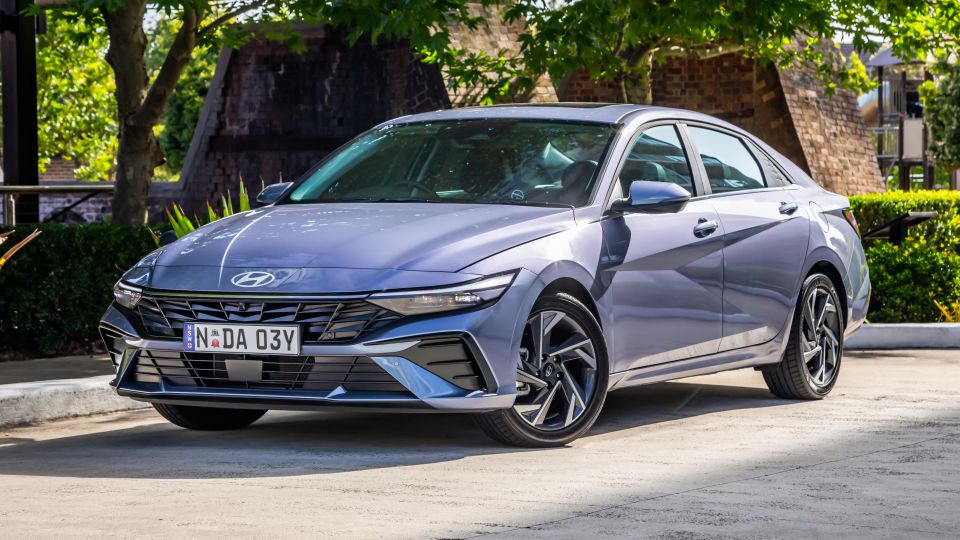
Kia saw its sales decline 2.8 per cent yet it held onto fourth place ahead of Hyundai, its biggest shareholder, with the latter’s 2.5 per cent sales increase insufficient to take back its expected place.
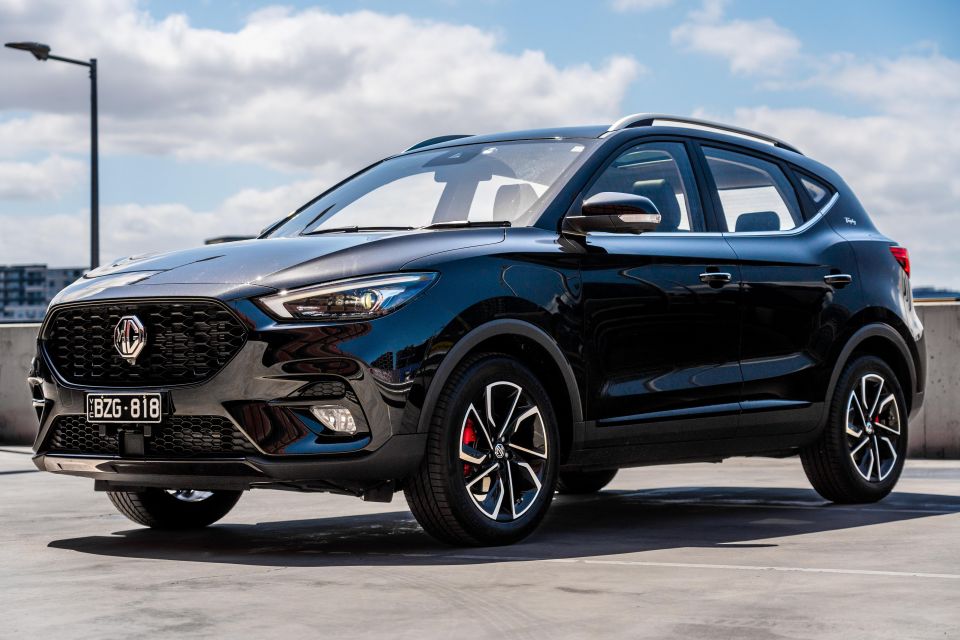
Completing the top 10 were Mitsubishi (down 17.5 per cent with the all-new new Triton just around the corner and the old one deep into its runout phase), MG (up 17.7 per cent), Tesla (up 135.4 per cent, and by far the dominant EV player), Subaru (up a healthy 28 per cent), and Isuzu Ute (up 28.4 per cent).
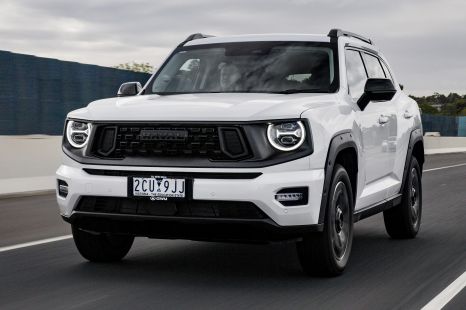
The next trio of brands – Volkswagen, Nissan and GWM – all enjoyed more than 40 per cent sales growth year-over-year on the back of better supply for the first two and more models for the latter.
Mercedes-Benz edged its BMW arch nemesis overall, but if you remove vans from the former’s result to make it a more even playing field, BMW (26,184, up 15.4 per cent) actually conquered Benz (24,315, down 9.3 per cent).
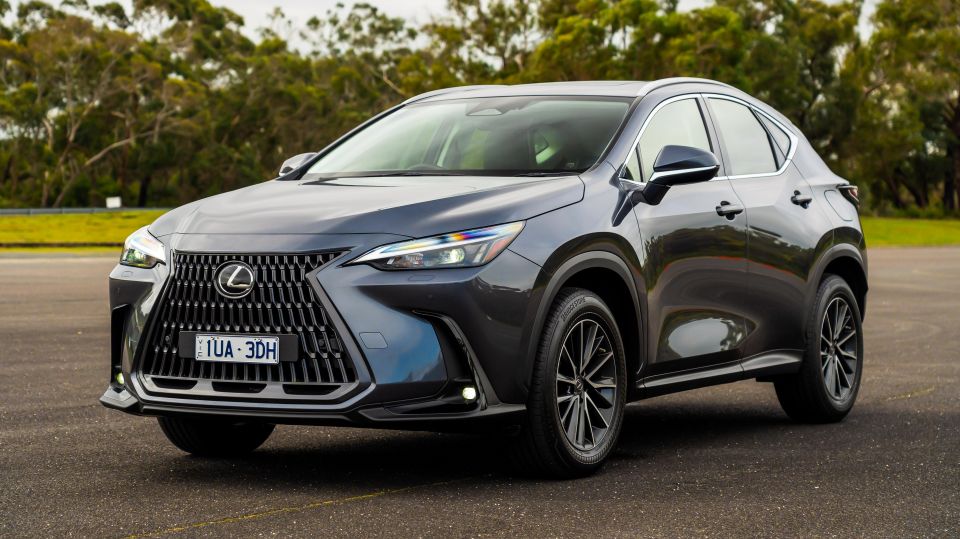
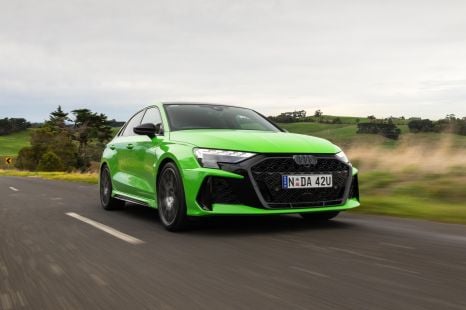
Fellow luxury brands Audi (up 29.2 per cent) and Lexus (up 114.3 per cent for a new record) made the three-pointed star marque’s negative result look even worse in context.
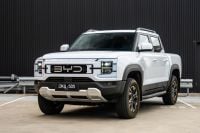
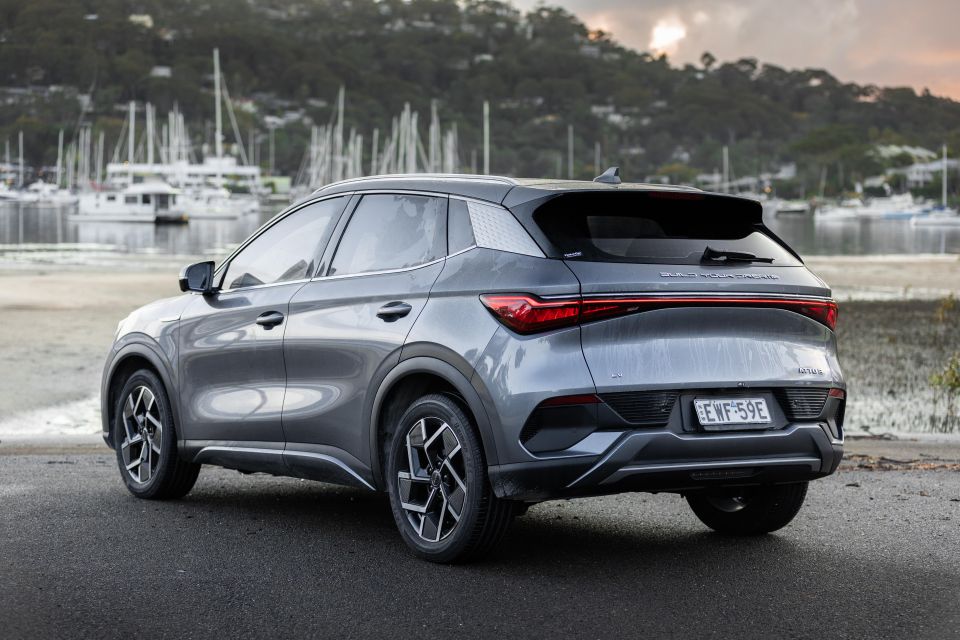
Some other brands that outperformed the overall market were LDV (up 30.9 per cent), BYD (up a staggering 488.6 per cent and easily Tesla’s closest EV competitor now), Land Rover (up 93.8 per cent), Skoda (up 23 per cent), SsangYong (up 51.3 per cent), Mini (up 42.9 per cent), Cupra (up 238.9 per cent), and Chevrolet (up 41.7 per cent).
Brands that finished 2023 in the proverbial ‘red’ included Kia, Mitsubishi and Mercedes-Benz as mentioned, as well as Suzuki (down 20.9 per cent), Honda (down 3.4 per cent), Renault (down 9.4 per cent), Jeep (down 30.4 per cent), Jaguar (down 17 per cent), and Citroen (down 23 per cent).
2023 sales results by brand:
| Brand | Sales | Over 2022 |
|---|---|---|
| Toyota | 215,240 | -6.8% |
| Mazda | 100,008 | 4.5% |
| Ford | 87,800 | 31.8% |
| Kia | 76,120 | -2.8% |
| Hyundai | 75,183 | 2.5% |
| Mitsubishi | 63,511 | -17.5% |
| MG | 58,346 | 17.7% |
| Tesla | 46,116 | 135.4% |
| Subaru | 46,114 | 28.0% |
| Isuzu Ute | 45,341 | 28.4% |
| Volkswagen | 43,821 | 41.6% |
| Nissan | 39,376 | 48.6% |
| GWM | 36,397 | 45.3% |
| Mercedes-Benz | 28,853 | -7.8% |
| BMW | 26,184 | 15.4% |
| LDV | 21,298 | 30.9% |
| Audi | 19,039 | 29.2% |
| Suzuki | 17,078 | -20.9% |
| Lexus | 15,192 | 114.3% |
| Honda | 13,734 | -3.4% |
| BYD | 12,438 | 488.6% |
| Volvo Car | 11,128 | 3.9% |
| Land Rover | 8425 | 93.8% |
| Renault | 8024 | -9.4% |
| Skoda | 7999 | 23.0% |
| Ram | 6833 | 11.1% |
| Porsche | 6052 | 7.9% |
| SsangYong | 5966 | 51.3% |
| Chery | 5890 | – |
| Jeep | 4634 | -30.4% |
| Mini | 4289 | 42.9% |
| Cupra | 3765 | 238.9% |
| Chevrolet | 3703 | 41.7% |
| Peugeot | 2516 | 20.6% |
| Polestar | 2463 | 61.6% |
| Fiat | 2062 | 77.6% |
| Genesis | 1916 | 84.4% |
| Alfa Romeo | 716 | 25.4% |
| Maserati | 638 | 7.4% |
| Jaguar | 581 | -17.0% |
| Lamborghini | 241 | 36.9% |
| Bentley | 229 | 12.8% |
| Citroen | 228 | -23.0% |
| Ferrari | 215 | 5.9% |
| Lotus | 183 | 195.2% |
| Aston Martin | 157 | 18.9% |
| McLaren | 85 | 39.3% |
| Rolls-Royce | 49 | -18.3% |
The top 20 nameplates list comprised five pickups (including the top three outright), seven mid-sized SUVs, two small SUVs, two large SUVs, and just four traditional passenger cars (i30, Corolla, Model 3, MG 3).
Top 20 models in 2023:
EV-specific model top-sellers*:
Doesn’t include models with both ICE and EV options e.g. MG ZS or Hyundai Kona. We will run a full EV breakdown when we get more data
Sales by region
Category breakdown
Top segments by market share
Sales by buyer type
Sales by propulsion or fuel type
Sales by country of origin
Got any questions about car sales? Ask away in the comments and we’ll jump in!
Matt Campbell
6 Days Ago

James Wong
5 Days Ago

Max Davies
3 Days Ago

Josh Nevett
2 Days Ago
Josh Nevett
2 Days Ago

Paul Maric
14 Hours Ago