
Max Davies
2026 Ram 1500 Rebel review
6 Days Ago
A new report has detailed the cars and SUVs that hold their value the best, as well as how long on average they sit on dealer lots.

News Editor

News Editor
A new monthly report from the Australian Automotive Dealer Association (AADA) sheds light on not only which are Australia’s top-selling used cars, but also which ones hold their value the best.
The Automotive Insights Report (AIR) details the top 10 cars and SUVs with the best retained value, as well as how long they sit on dealer lots.
The AADA publishes data for both vehicles 2-4 years old, and vehicles 5-7 years old.
It notes retained values are gradually declining after the record highs of recent years, however there are still some vehicles exceeding their new market value.
The vehicles with the highest retained value aren’t necessarily the ones flying off dealer lots the quickest.


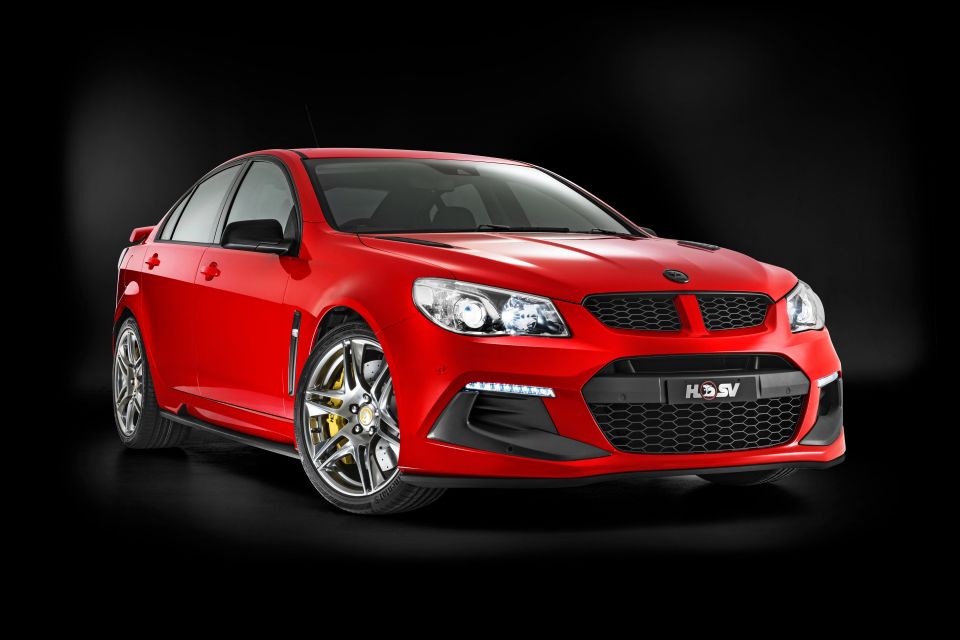
The 5-7 year old passenger car category, for example, is topped by the HSV Clubsport which retains a whopping 120.2 per cent of its value on average. But it takes an average of 118.9 days to sell, more than any other vehicle in the top 10 list.
In contrast, 5-7 year old examples of the Honda City retain a still impressive 89.2 per cent of their value on average, but take an average of just 15.1 days to sell.
The average time to sell a used car is 52 days, the highest it has been over the past 12 months.
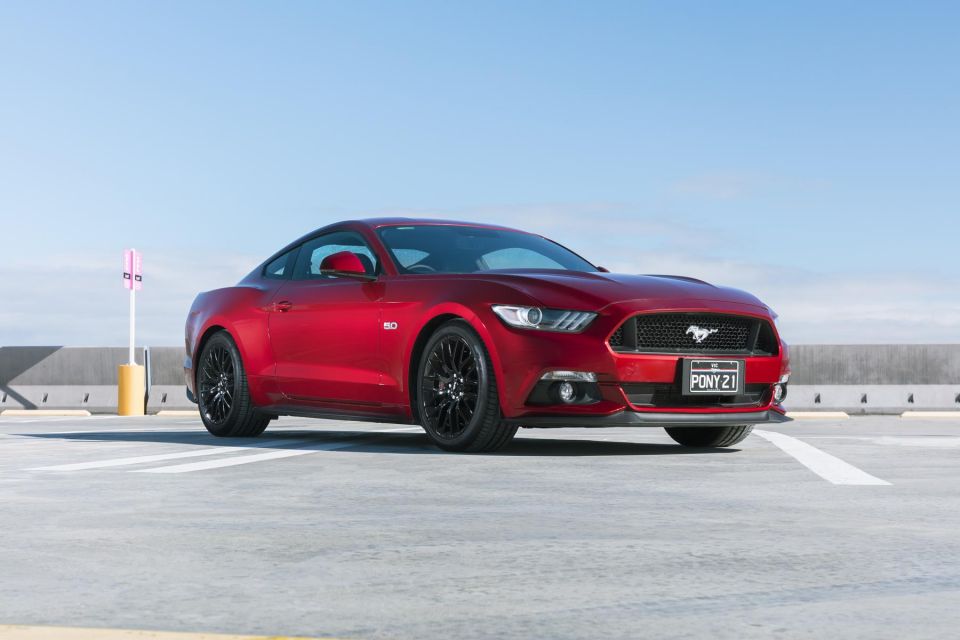
The passenger car lists are dominated by light cars like the Toyota Yaris and Mazda 2, but larger fare like the Ford Falcon and Mustang also feature.
In terms of SUVs, it’s a mix of both rugged, body-on-frame fare and small crossovers.
The AADA and AutoGrab use the following definitions:
Naturally, retained value is defined as how well a vehicle holds its value against its recommended retail price (RRP) when new.
“This figure is reported as a weighted average by vehicle segment and age group at each reporting period and provides a stable pricing trend movement,” the report reads.
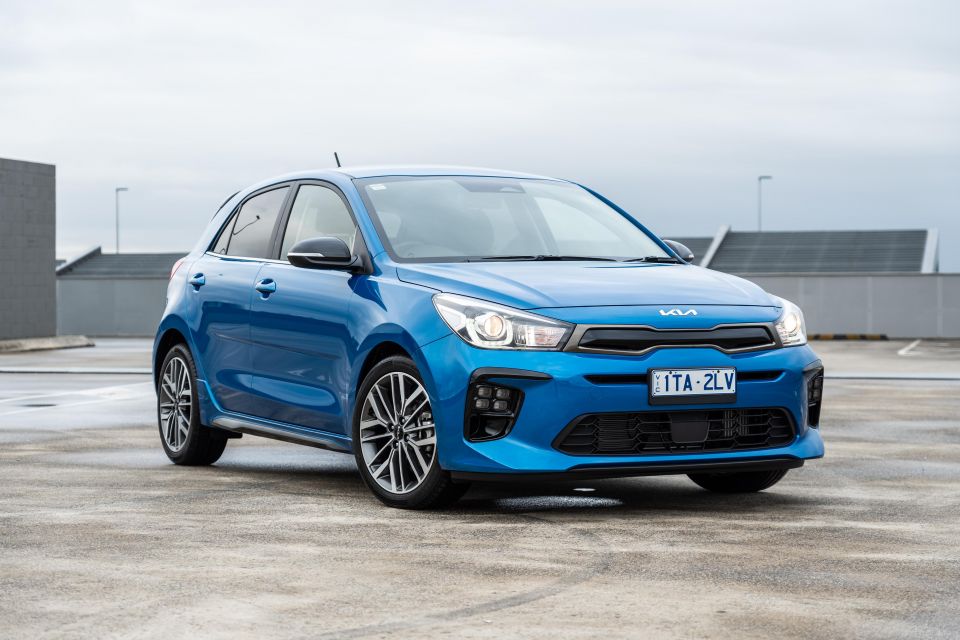
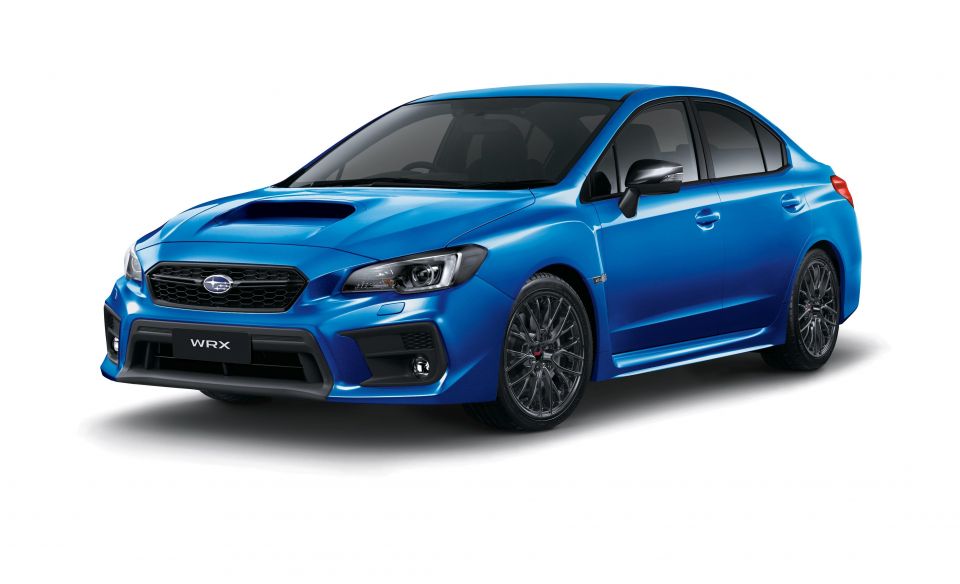
| Model | Average retained value (per cent) | Average days to sell |
|---|---|---|
| 1. Toyota Yaris | 110.3 per cent | 36.4 |
| 2. Honda Jazz | 104.6 per cent | 46.1 |
| 3. Kia Picanto | 103.0 per cent | 26.7 |
| 4. Toyota 86 | 101.4 per cent | 35.5 |
| 5. Toyota Corolla | 99.5 per cent | 46.5 |
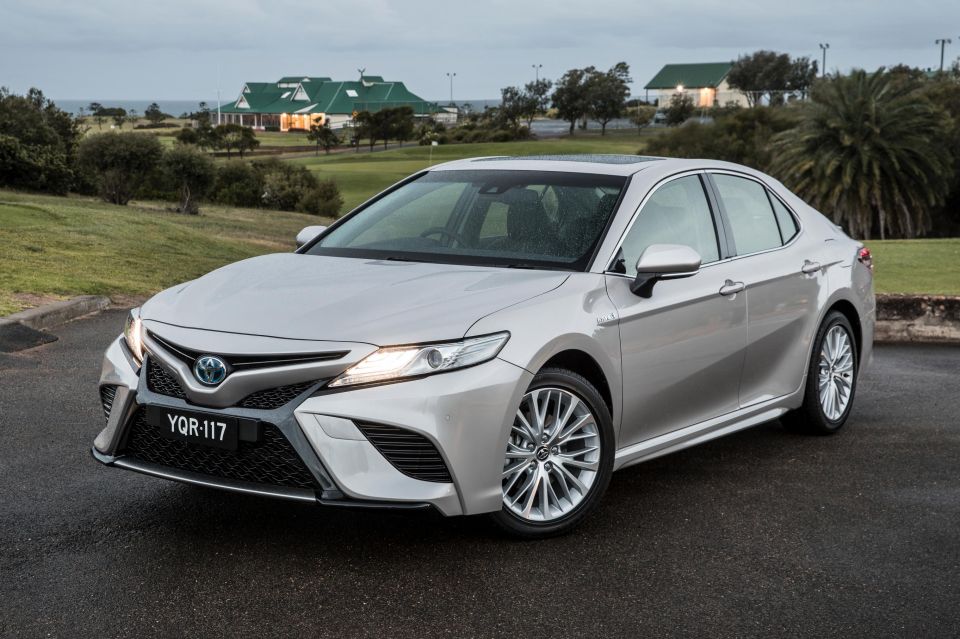
| 6. Toyota Camry | 97.8 per cent | 47.0 |
| 7. Subaru WRX | 97.5 per cent | 102.5 |
| 8. Mazda 2 | 95.8 per cent | 49.7 |
| 9. Kia Rio | 95.7 per cent | 56.2 |
| 10. Suzuki Baleno | 95.6 per cent | 28.2 |
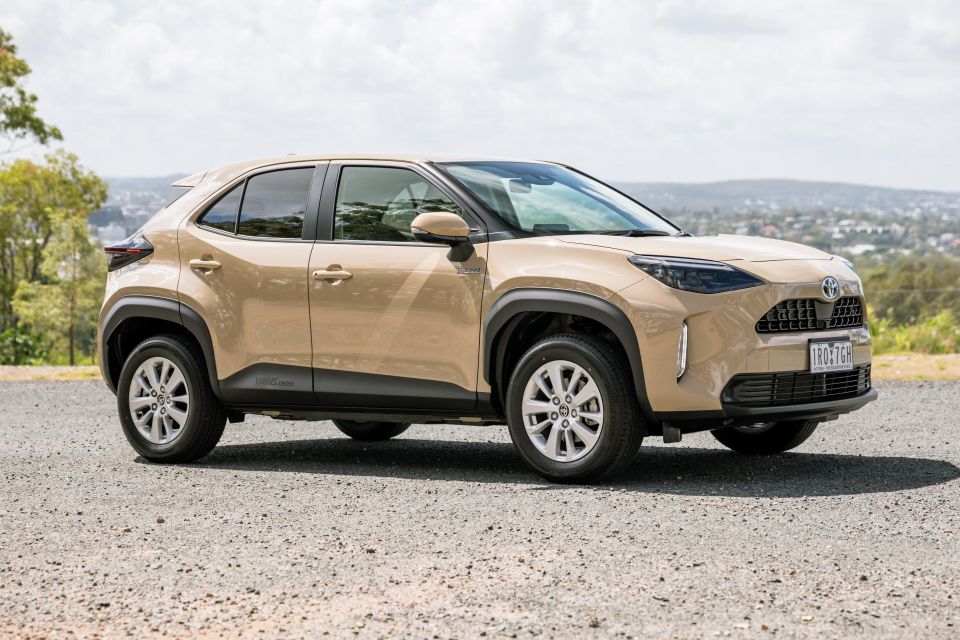
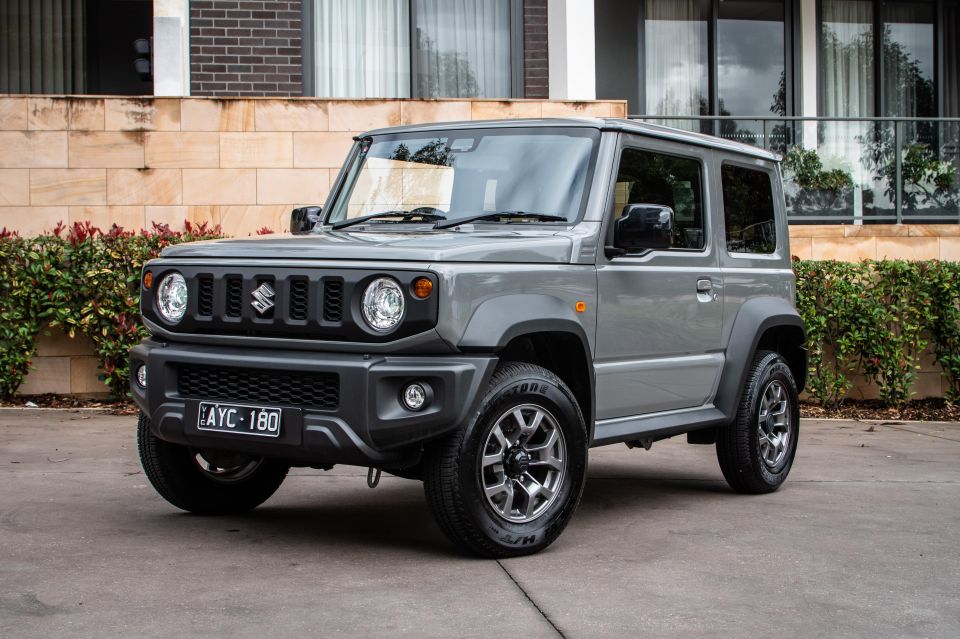
| Model | Average retained value (per cent) | Average days to sell |
|---|---|---|
| 1. Suzuki Jimny | 136.1 per cent | 42.3 |
| 2. Toyota Yaris Cross | 116.1 per cent | 64.2 |
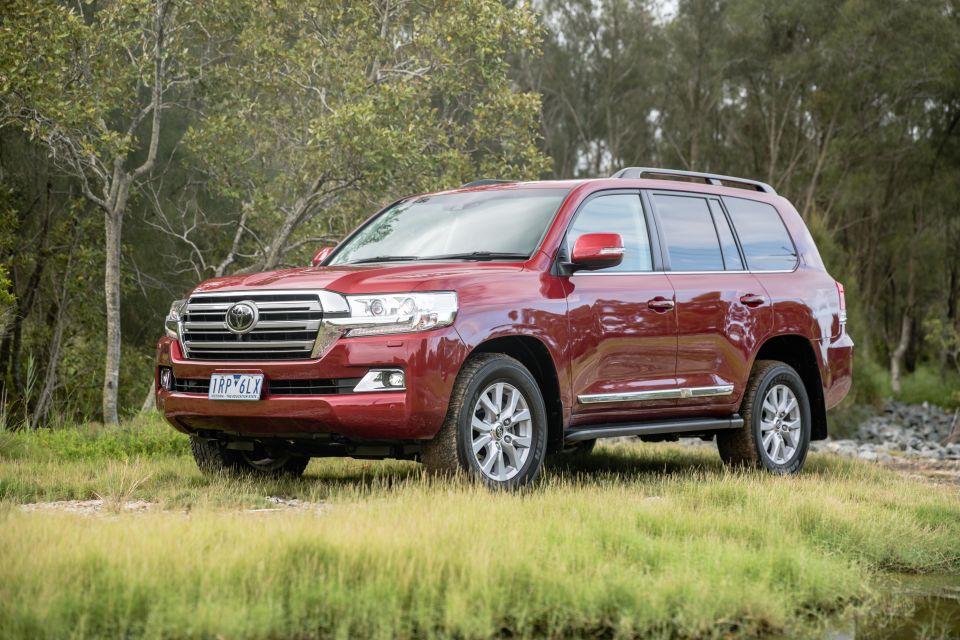
| 3. Toyota LandCruiser | 106.3 per cent | 55.1 |
| 4. Nissan Patrol | 104.5 per cent | 35.1 |
| 5. Toyota RAV4 | 103.2 per cent | 50.5 |
| 6. Toyota Fortuner | 97.9 per cent | 46.6 |
| 7. Toyota C-HR | 96.3 per cent | 46.9 |
| 8. Jeep Wrangler | 95.7 per cent | 61.5 |
| 9. Toyota LandCruiser Prado | 93.3 per cent | 51.6 |
| 10. Hyundai Venue | 92.6 per cent | 43.3 |
| Model | Average retained value (per cent) | Average days to sell |
|---|---|---|
| 1. HSV Clubsport | 120.2 per cent | 118.9 |
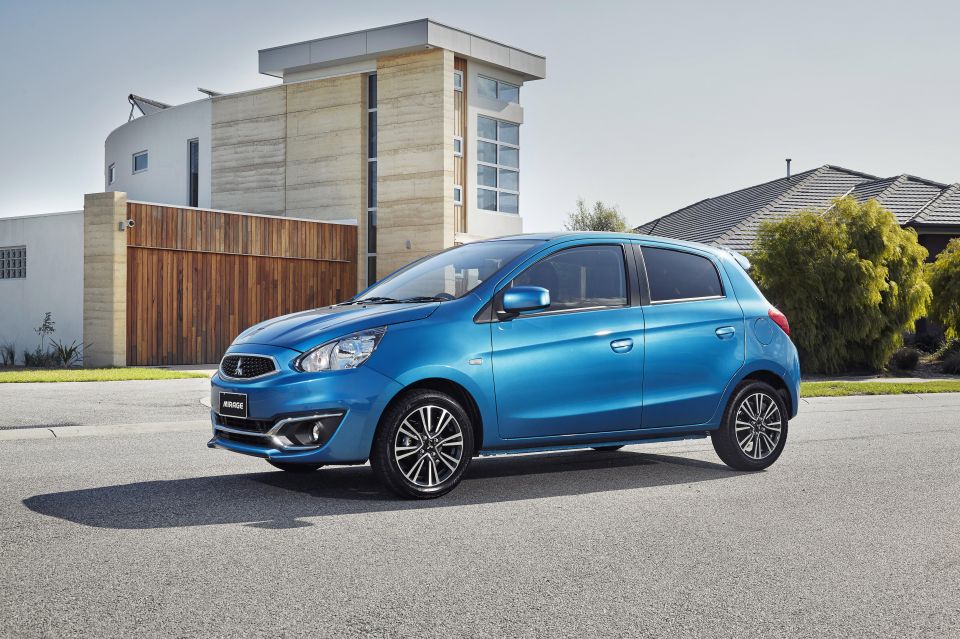
| 2. Mitsubishi Mirage | 117.2 per cent | 47.5 |
| 3. Toyota Yaris | 96.2 per cent | 29.1 |
| 4. Kia Picanto | 90.1 per cent | 34.6 |
| 5. Honda City | 89.2 per cent | 15.1 |
| 6. Toyota 86 | 87.1 per cent | 54.6 |
| 7. Mazda 2 | 86.9 per cent | 33.3 |
| 8. Ford Falcon | 86.7 per cent | 80.4 |
| 9. Ford Mustang | 85.2 per cent | 54.9 |
| 10. Honda Civic | 83.8 per cent | 41.4 |

| Model | Average retained value (per cent) | Average days to sell |
|---|---|---|
| 1. Toyota LandCruiser | 93.9 per cent | 57.5 |
| 2. Suzuki Ignis | 91.98 per cent | 46.1 |
| 3. Jeep Wrangler | 86.6 per cent | 77.9 |
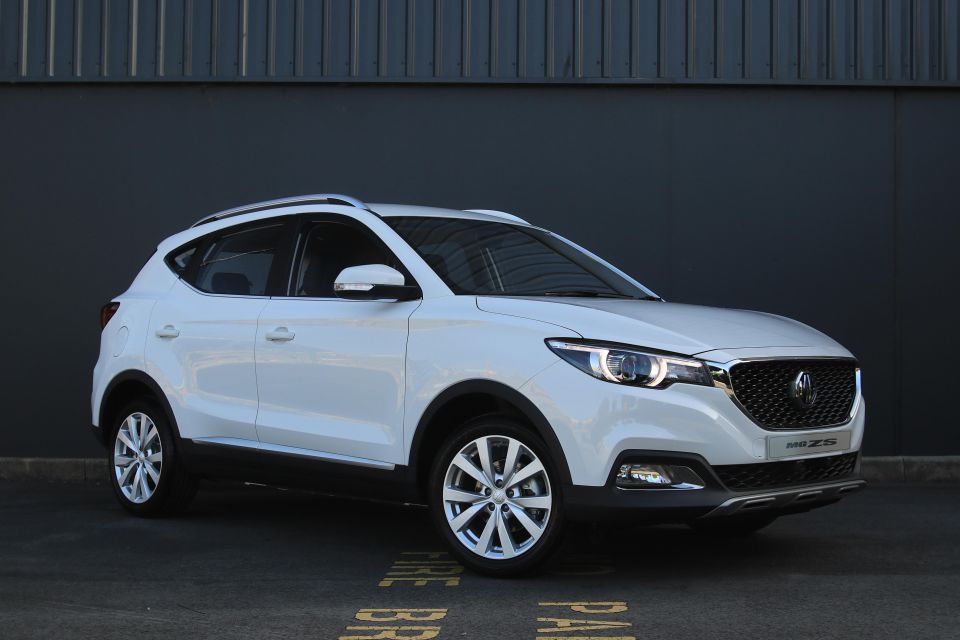
| 4. MG ZS | 85.1 per cent | 43.4 |
| 5. Nissan Patrol | 83.8 per cent | 54.8 |
| 6. Hyundai Kona | 81.4 per cent | 47.5 |
| 7. Toyota Fortuner | 80.9 per cent | 59.1 |
| 8. Mazda CX-3 | 79.3 per cent | 38.4 |
| 9. Honda HR-V | 77.9 per cent | 43.0 |
| 10. Toyota LandCruiser Prado | 77.8 per cent | 56.8 |
William Stopford is an automotive journalist based in Brisbane, Australia. William is a Business/Journalism graduate from the Queensland University of Technology who loves to travel, briefly lived in the US, and has a particular interest in the American car industry.


Max Davies
6 Days Ago

Max Davies
4 Days Ago

Neil Briscoe
3 Days Ago

Max Davies
2 Days Ago

James Wong
21 Hours Ago

William Stopford
19 Hours Ago