After months of growth and record sales for used cars in Australia, the market has taken a slight downturn, affecting almost all vehicles apart from fuel-saving hybrids.
Data compiled by AutoGrab and published by the Australian Automotive Dealer Association (AADA) shows 206,804 used vehicles were sold throughout August, a 3.6 per cent decrease on the month prior.
July was the third month in a row where a new record monthly sales figure was set since the AADA’s Automotive Insights Report (AIR) debuted at the end of 2023.
But though August broke this streak of records, its sales figures were still above those of June.
The slight sales decrease came despite a 4.9 per cent rise in the number of used vehicle listings, with private sellers accounting for almost one-third of the market.
100s of new car deals are available through CarExpert right now. Get the experts on your side and score a great deal. Browse now.
The average days it takes to sell a used car has continued to fall, reaching a new low of 42.7 days, almost a full day less than the prior month.
“In line with the new car sales trends, demand has decreased for used cars, with all states, except South Australia and Tasmania, recording a drop in sales,” said AADA CEO James Voortman.
“There are some correlations to the new car market in terms of popularity of hybrid vehicles with hybrids experiencing an increase in sales, while petrol, diesel and electric all experienced a drop in sales.
“In comparison to July, the used EV market is now facing an oversupply, with sales seeing the largest drop among all fuel types, down 8.3 per cent to 1637. This may result in more competitive pricing, shaping buyer preferences as disposable incomes erode.”
While they are two of the smallest regions for used vehicle sales, the territories experienced the biggest drops, with the Australian Capital Territory’s figures dropping by 29.1 per cent while the Northern Territory went down by 37.4 per cent.
Sales of hybrids bucked the overall trend by increasing 0.6 per cent to 8435 examples sold, with niche LPG-powered cars increasing by 8.9 per cent.
Both petrol and diesel vehicle sales dropped by slightly more than the market average (3.7 and 3.9 per cent, respectively) while electric vehicles (EVs) experienced the biggest decrease, with sales falling by 8.3 per cent.
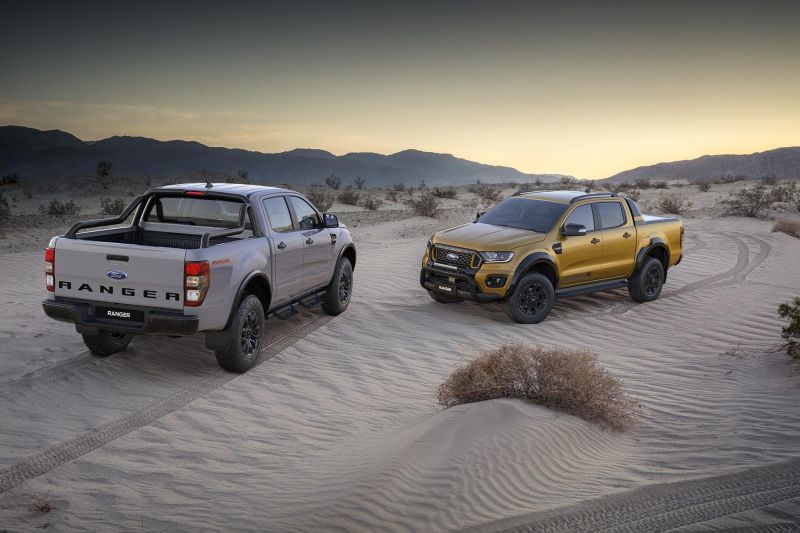
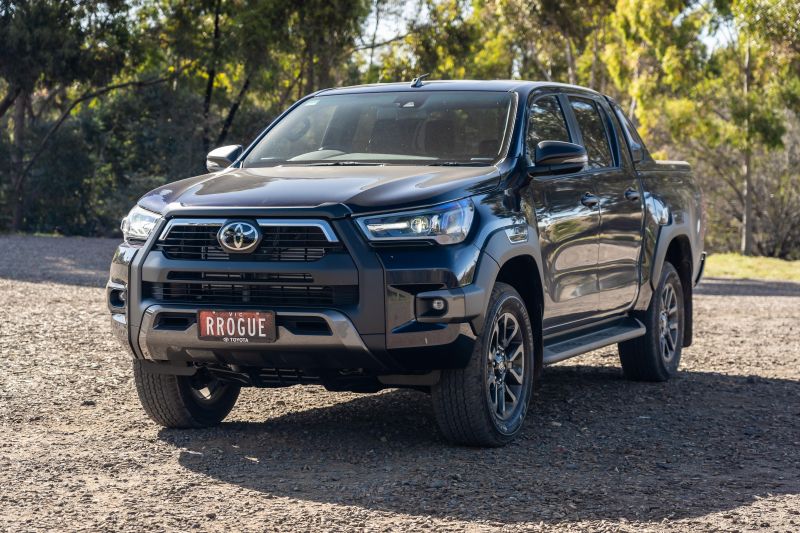
The Ford Ranger continued to be the best-selling used vehicle, also increasing sales on the month prior, though not by as much as its Toyota HiLux rival.
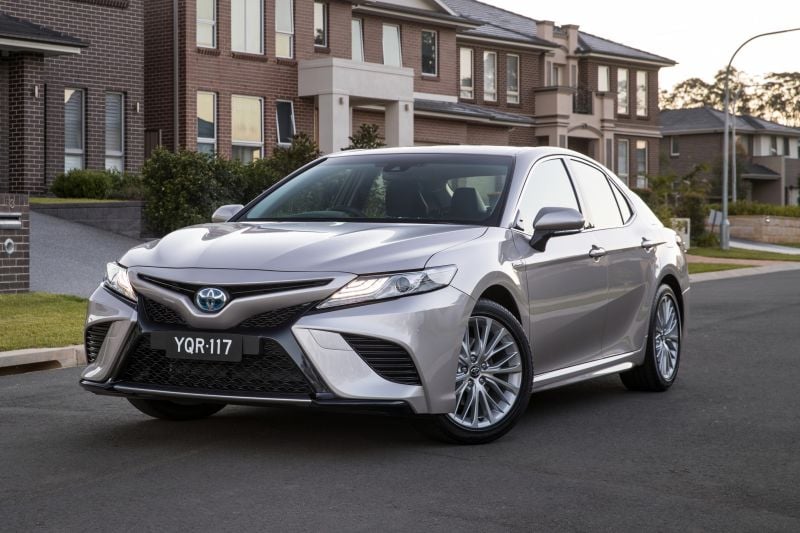
Toyota vehicles now occupy four of the top five spots, with the Corolla maintaining its podium spot ahead of the Camry (up from seventh) and RAV4 (up from eighth), both experiencing healthy sales months in August.
In a rarity for the year, the top 10 vehicles remained the same from the month prior, albeit in a reshuffled order.
The AADA and AutoGrab offer the following definitions for the monthly Automotive Insights Report:
- For Sale: Level of available used and demo cars listed online by dealers and private sellers nationally at the time of reporting. AutoGrab processes and de-duplicates listings to identify and eliminate repetitions, ensuring that vehicles listed across multiple platforms are counted only once.
- Sales: Total vehicles delisted from online marketplaces, serving as a close proxy to actual sales and recorded monthly. The delisting count also reflects unique vehicles, as AutoGrab processes and deduplicates listings to identify and eliminate repetitions, ensuring that vehicles listed across multiple platforms are counted only once.
Best-selling used cars (up to 10 years old)
| Model | Sales (August 2024) | Change from July | Average days to sell |
|---|---|---|---|
| Ford Ranger | 5410 | +0.3% | 46.6 |
| Toyota HiLux | 4242 | +3.0% | 42.2 |
| Toyota Corolla | 3452 | -5.0% | 33.5 |
| Toyota Camry | 2558 | +9.1% | 36.9 |
| Toyota RAV4 | 2496 | +3.4% | 38.4 |
| Hyundai i30 | 2475 | -3.2% | 31.2 |
| Mitsubishi Triton | 2414 | -2.3% | 43.8 |
| Mazda 3 | 2216 | -4.8% | 34.6 |
| Mazda CX-5 | 2057 | -2.5% | 41.1 |
| Nissan Navara | 1819 | -6.1% | 48.3 |
Used car sales by state and territory
| State/territory | Vehicles listed | Vehicles sold |
|---|---|---|
| New South Wales | 90,000 (+6.1%) | 58,574 (-3.5%) |
| Victoria | 80,201 (+4.3%) | 49,519 (-3.0%) |
| Queensland | 67,551 (+2.8%) | 47,689 (-4.6%) |
| Western Australia | 31,015 (+15.1%) | 27,970 (-1.0%) |
| South Australia | 19,122 (+2.3%) | 14,721 (+0.3%) |
| Tasmania | 5624 (+3.1%) | 4653 (+1.8%) |
| Australian Capital Territory | 3920 (-15.4%) | 2571 (-29.1%) |
| Northern Territory | 1714 (-14.9%) | 927 (-37.4%) |
| Total | 299,147 (+4.9%) | 206,804 (-3.6%) |
Sales by vehicle type
| Listed for sale | Total sales | |
|---|---|---|
| Passenger cars | 114,657 (+3.0%) | 86,454 (-2.5%) |
| SUVs | 115,380 (+6.8%) | 78,675 (-5.1%) |
| Utes | 57,587 (+4.0%) | 35,627 (-2.7%) |
| Vans and buses | 11,523 (+10.2%) | 6048 (-5.6%) |
Sales by fuel type
| Vehicle type | Sales (August 2024) | Change from July |
|---|---|---|
| Petrol | 133,247 | -3.7% |
| Diesel | 63,008 | -3.9% |
| Hybrid | 8435 | +0.6% |
| EV | 1637 | -8.3% |
| LPG | 281 | +8.9% |
| Plug-in hybrid (PHEV) | 196 | -1.0% |
Average retained value
| Vehicle type | Average retained value |
|---|---|
| Passenger (2-4 years old) | 81.1% |
| Passenger (5-7 years old) | 67.3% |
| SUV (2-4 years old) | 75.0% |
| SUV (5-7 years old) | 59.7% |
| Light commercial vehicles and utes (2-4 years old) | 76.9% |
| Light commercial vehicles and utes (5-7 years old) | 66.5% |
MORE: Used car sales skyrocket as prices come down
MORE: How used car sales are booming in Australia
MORE: Used vehicle sales surge in Australia, driving down prices for buyers
MORE: Used car sales April 2024: Hybrids and EVs defy slow market
MORE: Used car sales March 2024 – Market up, EVs see big gains
MORE: Used car sales drop, but they’re selling more quickly
MORE: Used car sales rise in strong start to 2024
MORE: Used EV, PHEV sales drop even as demand for new ones grows
MORE: Australia’s best-selling used cars in December 2023
MORE: Australia’s used car sales results for 2023 revealed

