
Max Davies
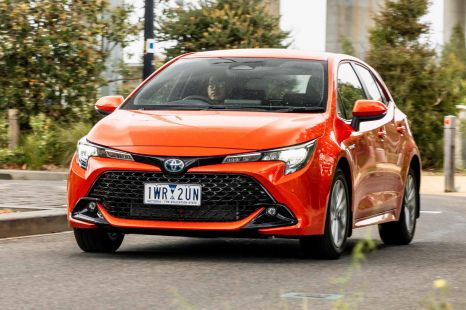
2025 Toyota Corolla SX review
6 Days Ago
Sales of Chinese-built cars overtook those of Korean-built cars in 2023, in what proved to be a record year for market share.

News Editor

News Editor
More Australians bought Chinese-built cars than Korean-built cars for the first year ever in 2023.
China became Australia’s third largest source of new vehicles in 2023 with 193,433 sales and a 15.9 per cent share of the market, behind only Japan (345,071 sales, 28.4 per cent share) and Thailand (264,253 sales, 21.7 per cent share).
This was an increase of 57.5 per cent over 2022, which helped propel China past Korea’s 161,614 sales. Korean car sales increased by 1.5 per cent over 2022’s tally but accounted for only 13.2 per cent of the market.
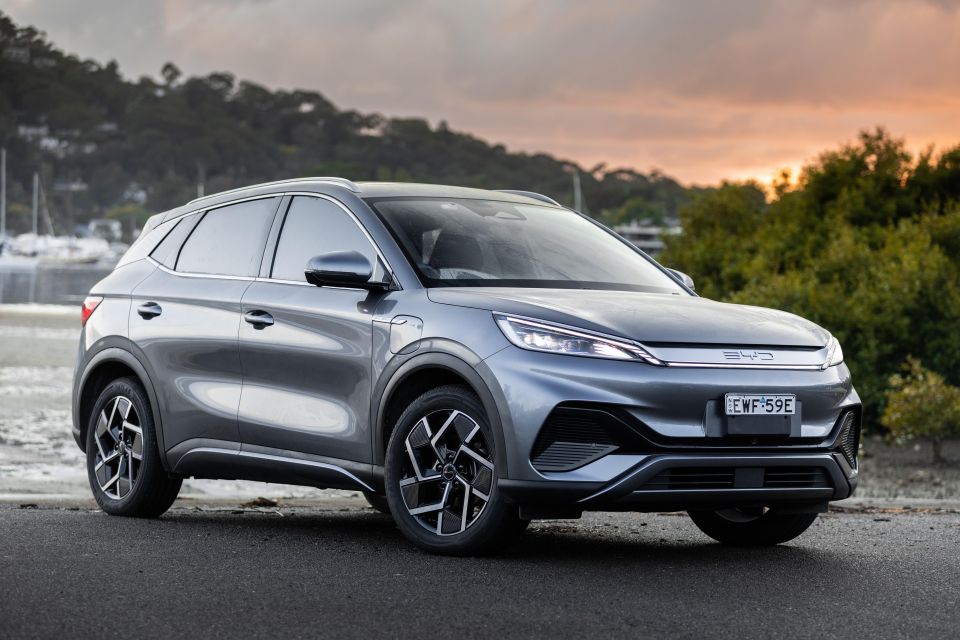
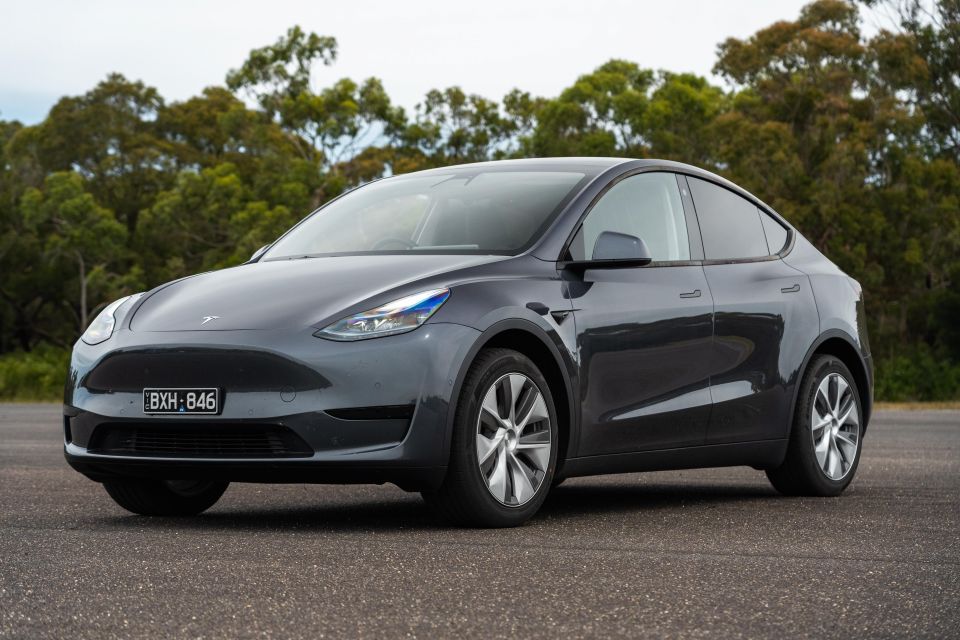
China’s increase was fuelled by double-digit (and even triple-digit) growth from all brands whose vehicles are all sourced from the Chinese market. These include:
| Brand | 2023 sales | Percentage increase over 2022 |
|---|---|---|
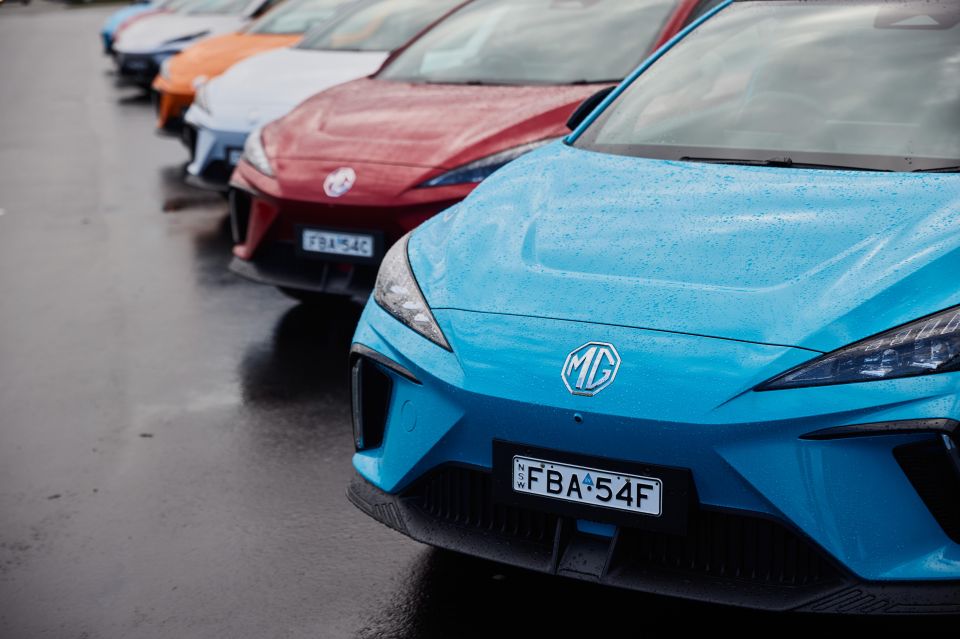
| MG | 58,346 | +17.7 per cent |
| Tesla | 46,116 | +135.4 per cent |
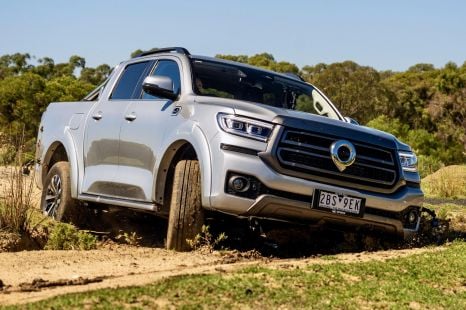
| GWM | 36,397 | +45.3 per cent |
| LDV | 21,298 | +30.9 per cent |
| BYD | 12,438 | +488.6 per cent |
| Polestar | 2463 | +61.6 per cent |
There’s also Chery, which returned to Australia in 2023 and sold 5890 vehicles, beating the likes of Jeep and Peugeot.
There are various vehicles from other brands that are sourced from China, including the Volvo C40 (1103 sales, up 124.6 per cent) and Citroen C5 X (68 sales, up 11.5 per cent).

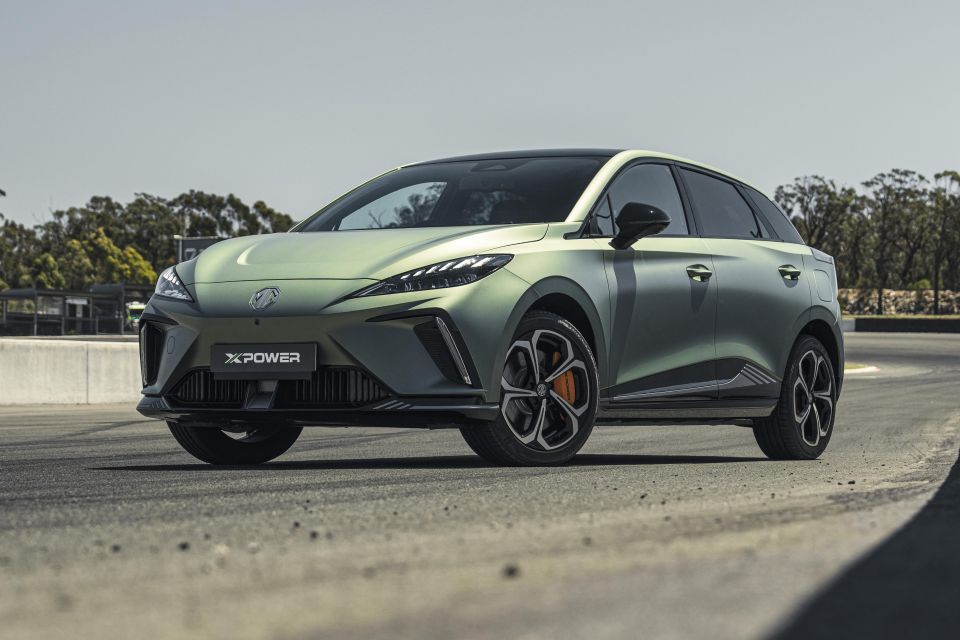
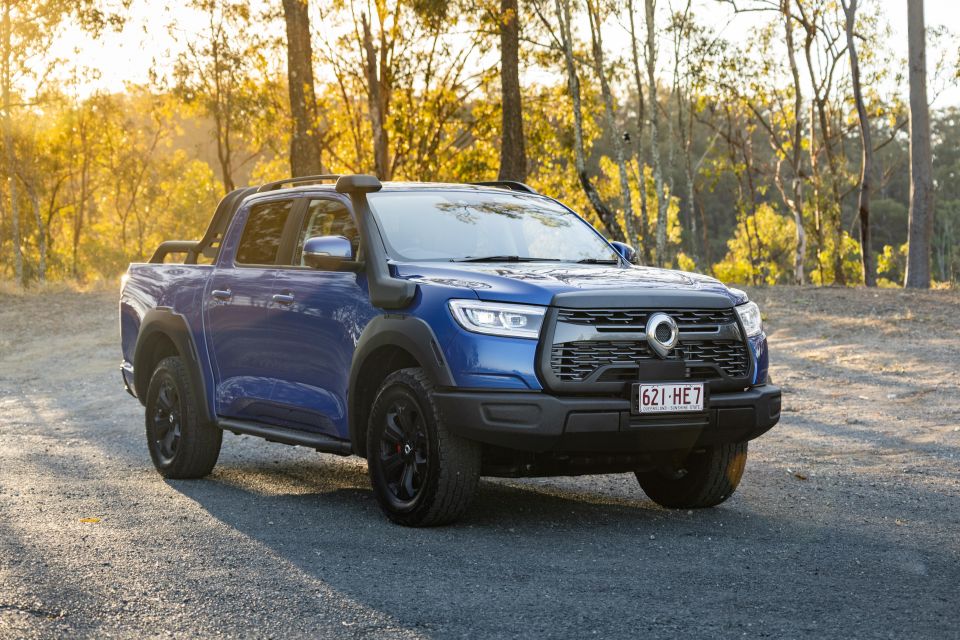

MG was the seventh best-selling brand in Australia in 2023, with Tesla in eighth place, GWM at 13th, and LDV at 16th.
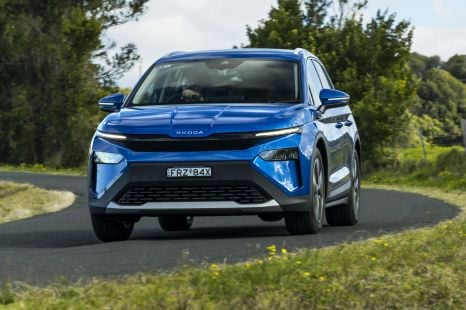
BYD was just out of the top 20 in 21st place, but it still managed to outsell myriad brands that have been here for longer including Renault (8024 sales), Skoda (7999 sales) and SsangYong (5966 sales).
Here are the top 10 countries of origin by sales volume in 2023:


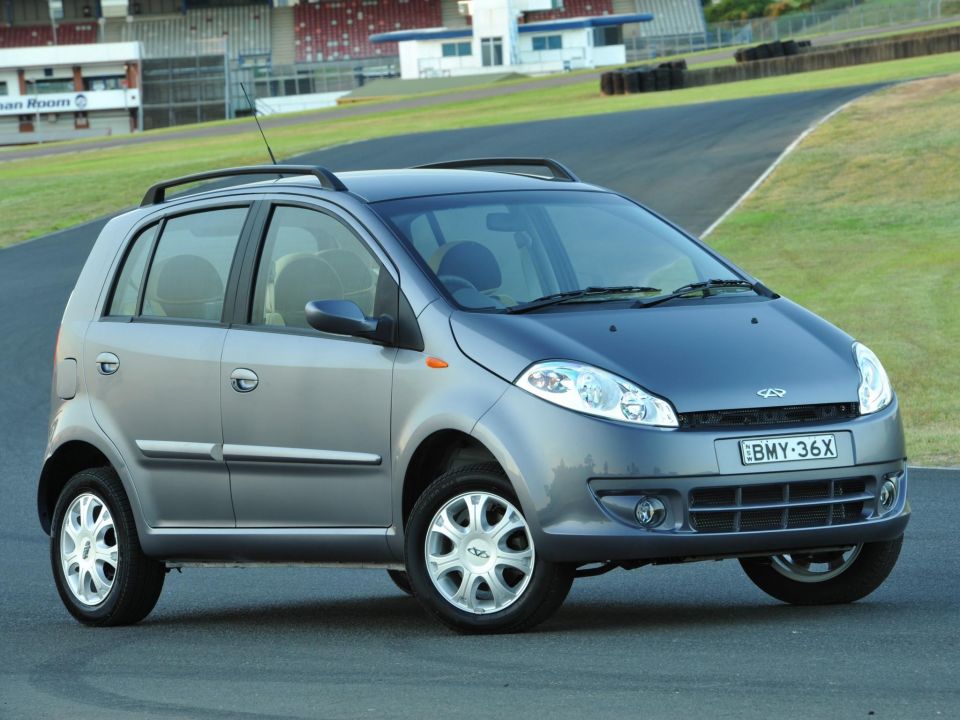
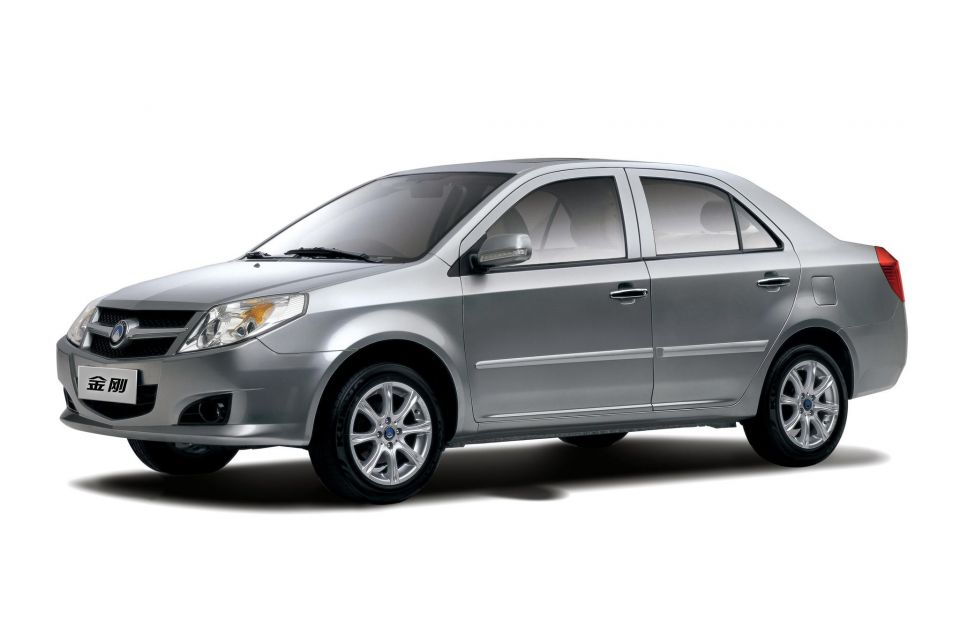
China has seen meteoric growth over the past few years.
The first surge of Chinese carmakers, which started in 2009 with Great Wall, ultimately fizzled as quality and safety woes caught up with the likes of Great Wall, Chery, Geely and others. By 2015, Chinese cars were effectively right back where they started from.
The Chinese brands regrouped, and have made significant leaps in terms of technology and safety. Not only that, but American and European brands like Tesla and BMW started using China as a production source for our market.
Here’s the history of Chinese car sales in Australia:
| Year | Total sales of Chinese-built vehicles | Percentage of overall market |
|---|---|---|
| 2009 | 1907 | 0.2 per cent |
| 2010 | 6690 | 0.7 per cent |
| 2011 | 10,487 | 1.03 per cent |
| 2012 | 12,139 | 1.09 per cent |
| 2013 | 7092 | 0.62 per cent |
| 2014 | 4154 | 0.37 per cent |
| 2015 | 2320 | 0.2 per cent |
| 2016 | 2927 | 0.24 per cent |
| 2017 | 4689 | 0.39 per cent |
| 2018 | 10,489 | 0.9 per cent |
| 2019 | 17,957 | 1.68 per cent |
| 2020 | 30,696 | 3.34 per cent |
| 2021 | 76,262 | 7.26 per cent |
| 2022 | 122,845 | 11.35 per cent |
| 2023 | 193,433 | 15.9 per cent |
Note: Sales of smaller Chinese brands like Geely and ZX Auto were never included in VFACTS sales reports. Also, the first Chinese-built vehicle sold in Australia was the Volkswagen Polo Classic in 2004.
MORE: VFACTS 2023: All-time Australian sales record, Ford Ranger tops charts
William Stopford is an automotive journalist based in Brisbane, Australia. William is a Business/Journalism graduate from the Queensland University of Technology who loves to travel, briefly lived in the US, and has a particular interest in the American car industry.


Max Davies
6 Days Ago

James Wong
4 Days Ago

James Wong
4 Days Ago

Max Davies
3 Days Ago

Josh Nevett
1 Day Ago

Max Davies
1 Day Ago