
Max Davies
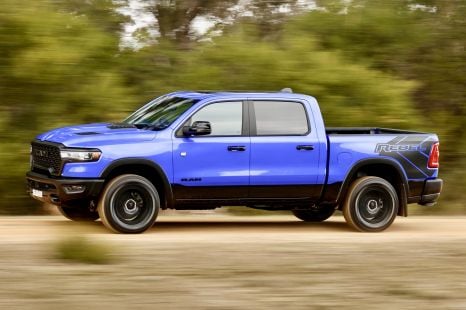
2026 Ram 1500 Rebel review
Ram Trucks Australia wants you to take your 1500 pickup off-road, but is the new Rebel really capable of handling the rough stuff?
5 Days Ago
We take a look at new vehicle sales over the past 25 years to see which brands have risen and which have fallen.

Publisher
Publisher
For the data nerds out there, or those of you that just love to see how different brands have managed their sales in Australia for the last 25 years, we have put together a visualisation that will showcase two things.
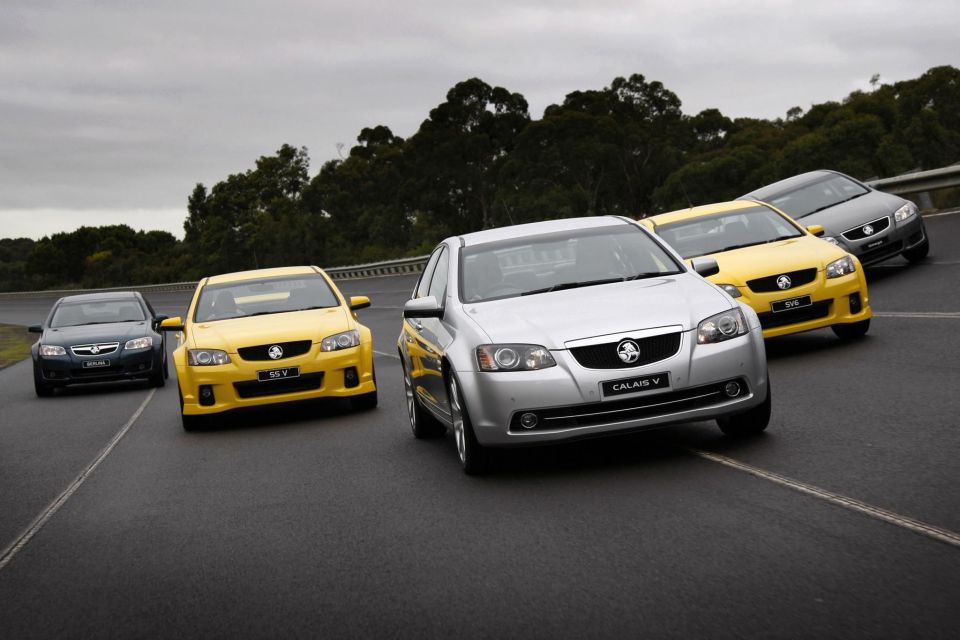
Firstly, the year-by-year sales chart below will show you how some brands moved up and down the charts as the years went by. Have a look at Holden in particular as it disappears from the landscape.
These figures are not cumulative and are reflective of year-by-year sales, including passenger vehicles, SUVs, and both light and heavy commercial vehicles.
Press play below the graph:
Now, here is a cumulative graph of all total sales for the last 25 years. This data is missing certain brands (e.g. Tesla) that didn’t report their sales for a number of years as the recent data would be inaccurate as a total.
This graph also includes passenger vehicle, SUV, and light and heavy commercial vehicle sales.
Press play below the graph:
Did the graphs surprise you?
Alborz is the founder of CarAdvice (sold to Nine and now Drive) and co-founder of CarExpert. He is an honourary adjunct professor & entrepreneur in residence at the University of QLD. He loves naturally-aspirated V8s, V10s and V12s and is in denial about the impending death of the internal combustion engine. The best way to reach him is via Instagram.
Max Davies
5 Days Ago
Max Davies
4 Days Ago

Neil Briscoe
3 Days Ago
Max Davies
2 Days Ago
Alborz Fallah
14 Hours Ago

Damion Smy
14 Hours Ago