
Andrew Maclean
Honda CR-V RS e:HEV vs Toyota RAV4 Edge Hybrid: Spec battle
5 Days Ago
Wondering how COVID-19 impacted your favourite brand's sales in 2020? Wonder no more.

Journalist

Journalist
It’s safe to say 2020 will be remembered for one thing: the Coronavirus pandemic.
In addition to the millions of people lost and countless lives it upended, it wrought havoc on the global economy and vehicle sales.
Unsurprisingly, all manufacturers saw a downturn in a sales.
Volkswagen and Toyota swapped places at the top of the sales chart, while the Stellantis merger – even though it only took place in 2021 – has opened up a spot in the top 10, allowing Suzuki to sneak in.
| Sales | Change from 2019 | Movement | ||
|---|---|---|---|---|
| 1 | Toyota Motor Corp | 9.3 million | -11.1 per cent | Up 1 place |
| 2 | Volkswagen Group | 9.1 million | -15.1 per cent | Down 1 place |
| 3 | Renault-Nissan-Mitsubishi Alliance | 7.8 million | -23.2 per cent | Steady |
| 4 | GM | 6.8 million | -11.5 per cent | Steady |
| 5 | Hyundai Motor Group | 6.4 million | -11.7 per cent | Steady |
| 6 | Stellantis | 6.3 million | -17.7 per cent | New FCA was 8th, PSA 9th |
| 7 | Honda | 4.4 million | -14.8 per cent | Steady |
| 8 | Ford Motor Company | 4.2 million | -22 per cent | Down 2 places |
| 9 | Daimler | 2.5 million | -13 per cent | Up 1 place |
| 10 | Suzuki | 2.5 million | -11.6 per cent | Up 1 place |
Developed economies have managed to (so far) soften the impact of the pandemic to their economies, and consequently auto sales have remained stronger.
Many emerging markets saw steep falls as their governments were unable to provide the same level of economic assistance as their richer counterparts.
The only two countries where a significant number of automakers saw gains were China and South Korea. Both countries have managed to contain the pandemic in their own unique ways.
After spending too much time parsing financial statements, we can confirm only three automakers routinely break out Australian numbers in their global sales figures: Mazda, Mitsubishi and Subaru.
Given all three are smaller manufacturers with a comparatively outsize presence here in Australia, that’s perhaps no surprise.
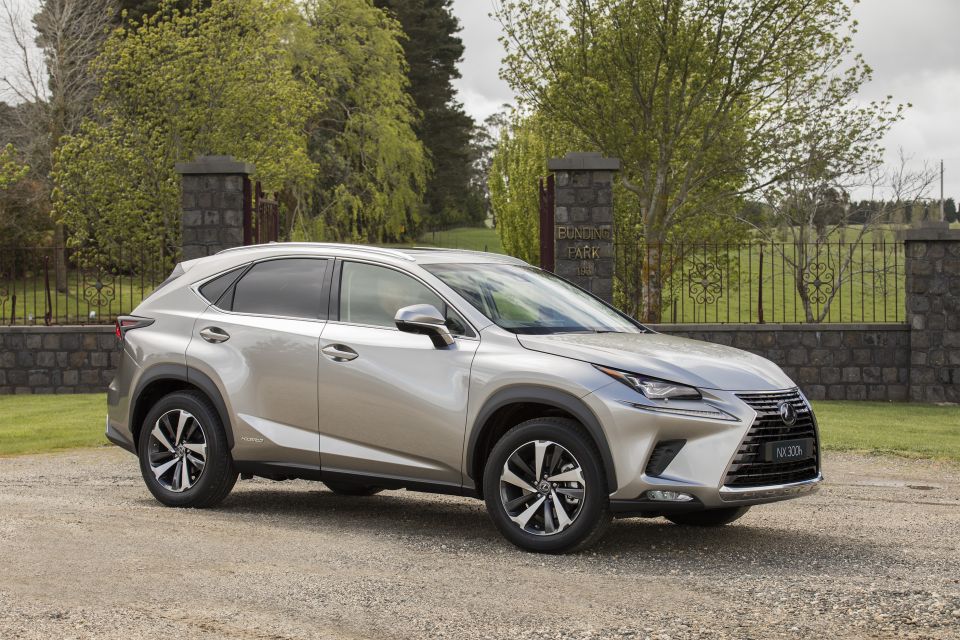
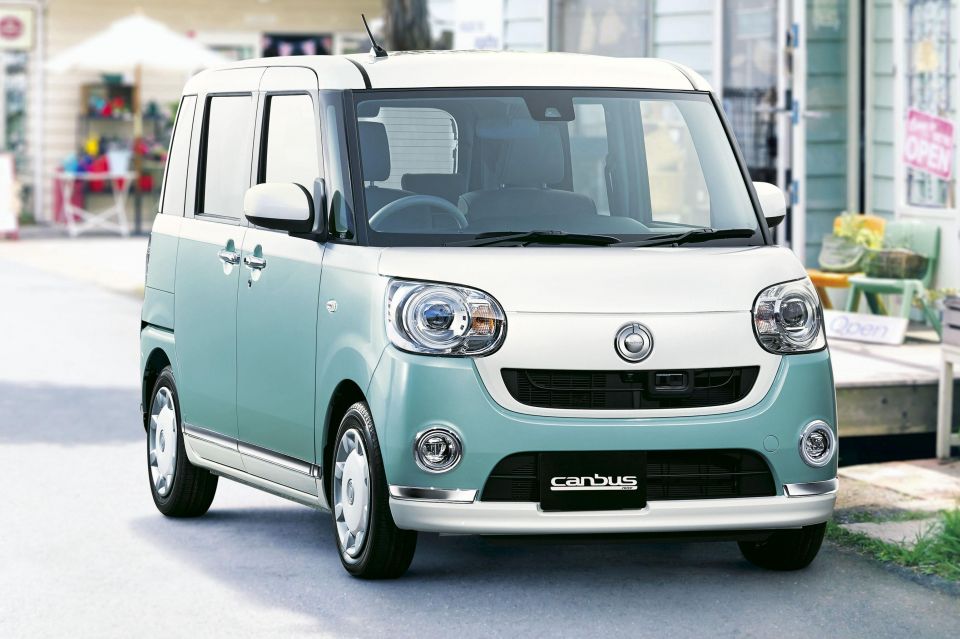
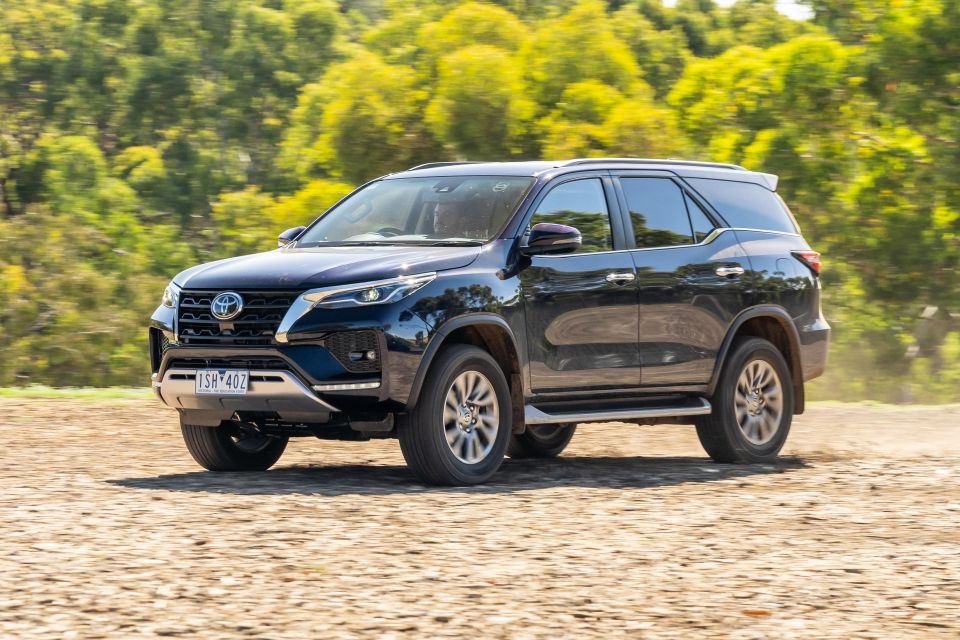
Toyota Motor Corporation sold 9,386,145 passenger cars across its three brands, a decrease of 11.1 per cent from 2019.
The Hino division sold 142,293 trucks in 2020, a decrease of 25.1 per cent. As with Volkswagen, we’ve removed this number from Toyota’s final tally.
| Sales | Change from 2019 | |
|---|---|---|
| Toyota | 7,973,453 | -11.0 per cent |
| Lexus | 718,715 | -6.1 per cent |
| Daihatsu | 693,977 | -17.2 per cent |
It’s more than 23 years since the original Prius was launched, and Toyota’s long-term investment in hybrid drivetrains is starting to pay off with significant sales across many parts of the globe.
Hybrids accounted for 1,905,941 of the company’s sales, a slight increase of 1.7 per cent over 2019.
Despite being an early mover in hybrids, Toyota has been much slower embracing plug-in hybrids. Represented primarily by the Prius Prime and RAV4 Prime, Toyota sold just 48,513 PHEVs in 2020, down 14.2 per cent.
Just 3346 pure EVs were sold by the company, which is infinitely more than the zero it retailed in 2019. A further 1770 Mirai fuel cell sedans also found new homes, a decrease of 29 per cent.
| Region | Sales | Change from 2019 |
|---|---|---|
| Asia (ex. Japan) | 2,768,581 | -6.8 per cent |
| – China | 1,797,487 | +10.9 per cent |
| – Thailand | 244,316 | -26.5 per cent |
| – Indonesia | 183,656 | -44.7 per cent |
| North America | 2,408,072 | -12.7 per cent |
| – USA | 2,112,941 | -11.3 per cent |
| Japan | 1,504,221 | -6.6 per cent |
| Europe | 961,699 | -8.5 per cent |
| Middle East | 358,933 | -21.1 per cent |
| Latin America | 280,257 | -31.2 per cent |
| Oceania | 243,508 | -5.0 per cent |
| – Australia | 213,647 | -0.8 per cent |
| Africa | 165,044 | -19.1 per cent |
| – South Africa | 88,008 | -30.7 per cent |
The largest market for Lexus was North America (296,779) down 8.6 per cent. This is followed by Asia (262,843) up 7.9 per cent.
In third place, Europe (69,094) was down 18.5 per cent while Japan (49,059) was next, down 21.4 per cent.
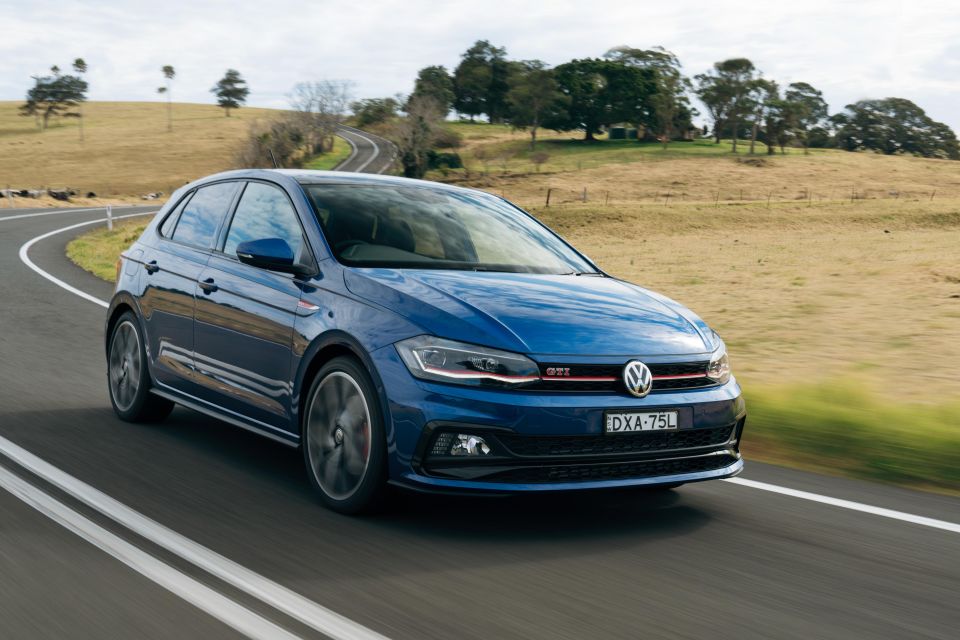
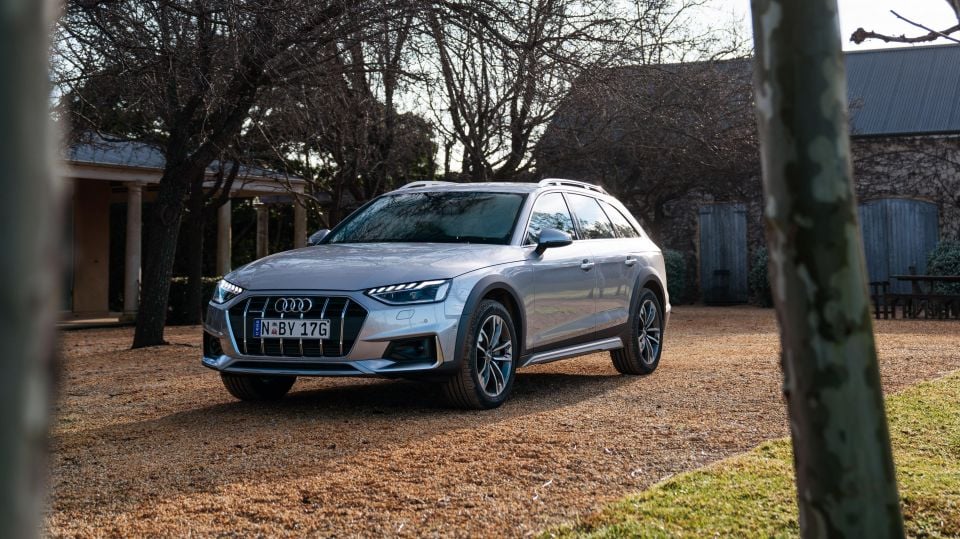
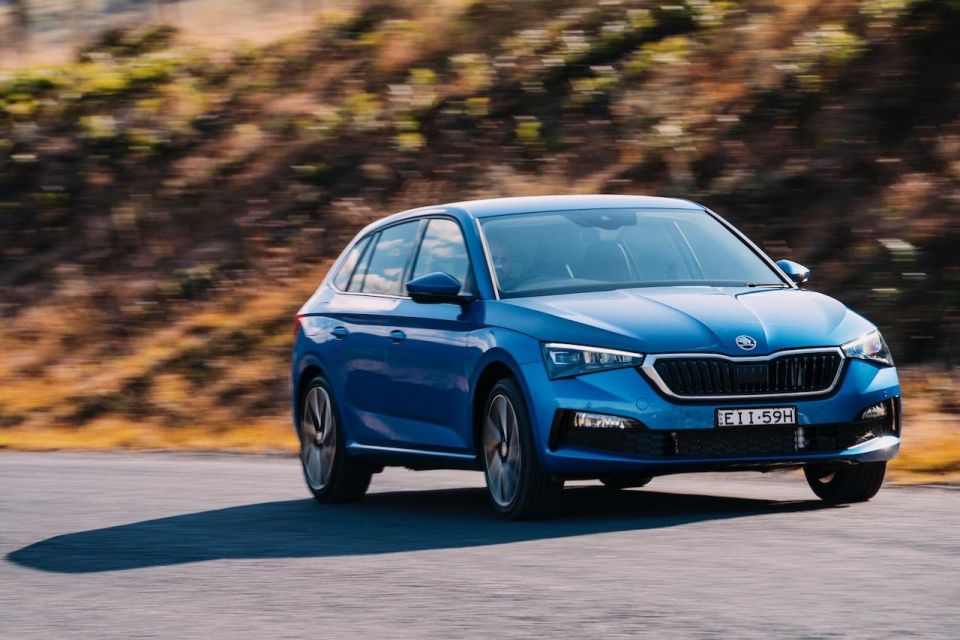
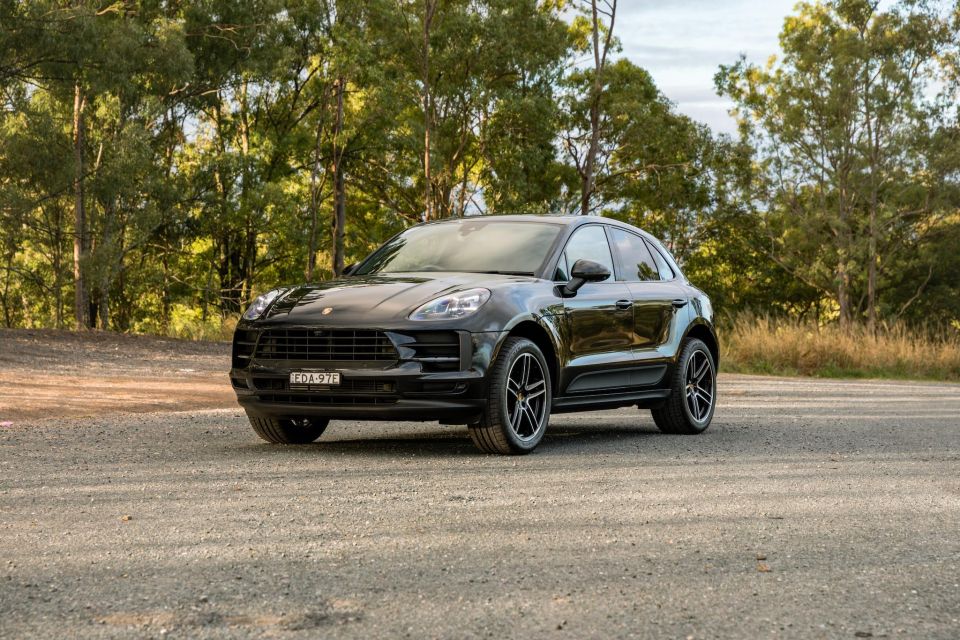
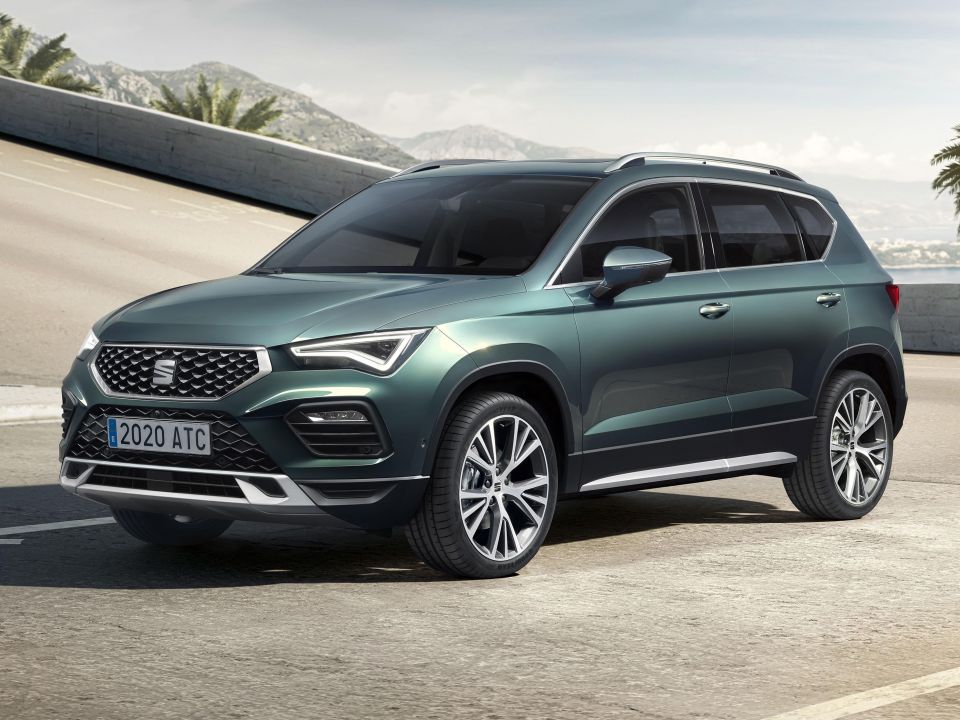
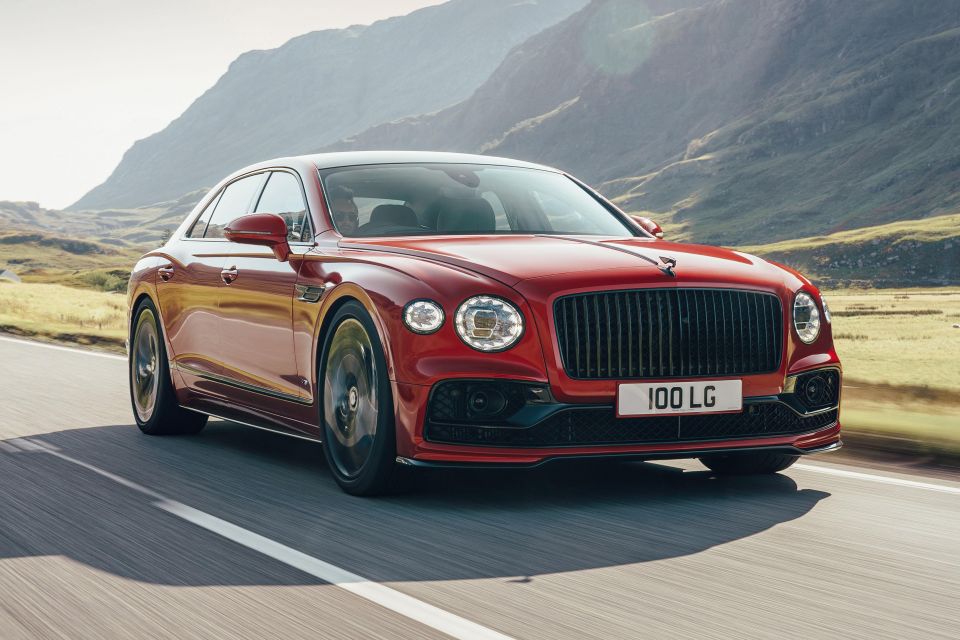
The Volkswagen Group sold 9,115,200 vehicles across its eight brands. This 15.1 per cent drop not only saw it fall below the 10 million mark, but also concede first place.
If you see the number 9,305,400 quoted elsewhere, this figure includes the sales of the MAN (118,100) and Scania (72,100) heavy truck brands.
For the purposes of this article, we’ve excluded heavy trucks as best we can from this article.
| Brand | Sales | Change from 2019 |
|---|---|---|
| Volkswagen (cars) | 5,328,000 | -15.1 per cent |
| Audi | 1,692,800 | -8.3 per cent |
| Skoda | 1,004,800 | -19.1 per cent |
| Seat | 427,000 | -25.6 per cent |
| Porsche | 272,200 | -3.1 per cent |
| Volkswagen Commercial Vehicles | 371,700 | -24.4 per cent |
| Others (incl. Bentley, Bugatti, Lamborghini) | 19,300 | -3.0 per cent |
There were big decreases in volume across the board, although Asia performed best due to its handling of the Coronavirus pandemic.
China – through the company’s partnerships with SAIC and FAW – remains the German firm’s largest single market, outselling all of Europe combined.
South America, and in particular Brazil, were hit hard by the pandemic, causing sales to fall almost 20 per cent. Despite this, the automaker’s share in the region grew as other companies suffered more.
| Region | Sales | Change from 2019 |
|---|---|---|
| Asia Pacific | 4,122,200 | -9.1 per cent |
| – China | 3,849,000 | -9.1 per cent |
| – Australia | 66,260 | -14.1 per cent |
| Europe | 3,616,900 | -20.5 per cent |
| North America | 785,800 | -17.4 per cent |
| – USA | 574,800 | -12.1 per cent |
| South America | 489,700 | -19.5 per cent |
| – Brazil | 377,600 | -19.7 per cent |
| Middle East, Africa | 290,700 | -12.3 per cent |
Last year saw Volkswagen’s big push into the world of electric cars begin, with mass production of the Volkswagen ID.3 kicking into gear.
Although production of the all-electric hatch got off to a rocky start due to problems related to its electronic systems, electric cars accounted for 11.6 per cent of the group’s sales in Germany, up from 1.5 per cent the year before.
Globally, the company sold 231,600 pure electric cars in 2020, or over three times as many as in 2019.
| EV model | Sales |
|---|---|
| Volkswagen ID.3 | 56,500 |
| Audi E-Tron | 47,300 |
| Volkswagen e-Golf | 41,300 |
| Volkswagen e-Up | 22,200 |
| Porsche Taycan | 20,000 |
The automaker also recorded a significant increase in plug-in hybrid sales, particularly in Western Europe, where the European Union fleet CO2 target of 95g/km is pushing automakers to aggressively roll out PHEVs and EVs.
Across the world, the conglomerate sold 190,500 plug-in hybrids, an increase of 175 per cent year-on-year. In Western Europe, PHEVs accounted for 10.5 per cent of sales, up from 1.9 per cent.
| PHEV model | Sales |
|---|---|
| Volkswagen Passat | 27,200 |
| Audi Q5 | 23,500 |
| Porsche Cayenne | 21,500 |
| Skoda Superb | 16,400 |
| Volkswagen Golf | 15,200 |
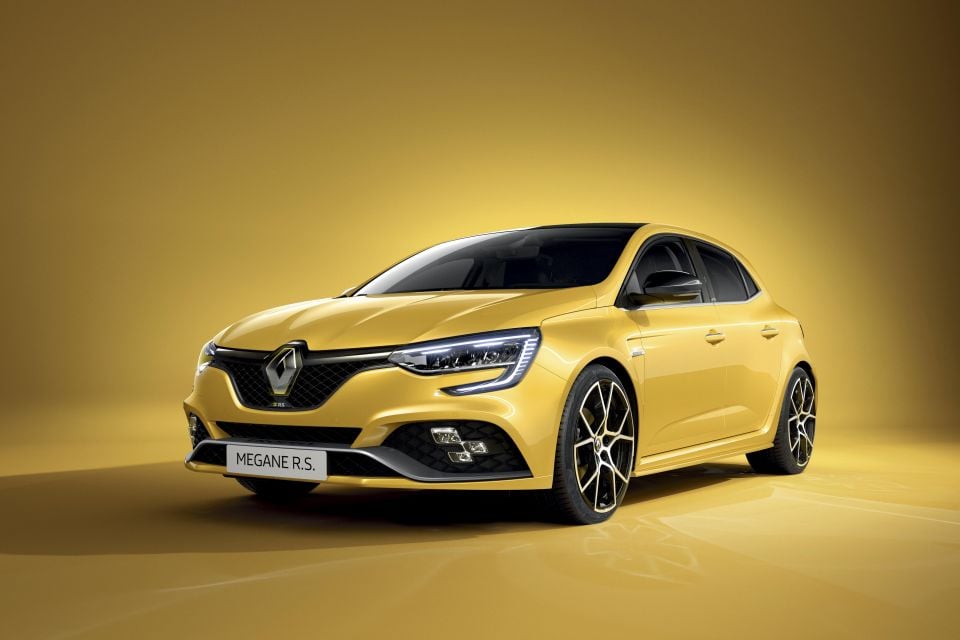
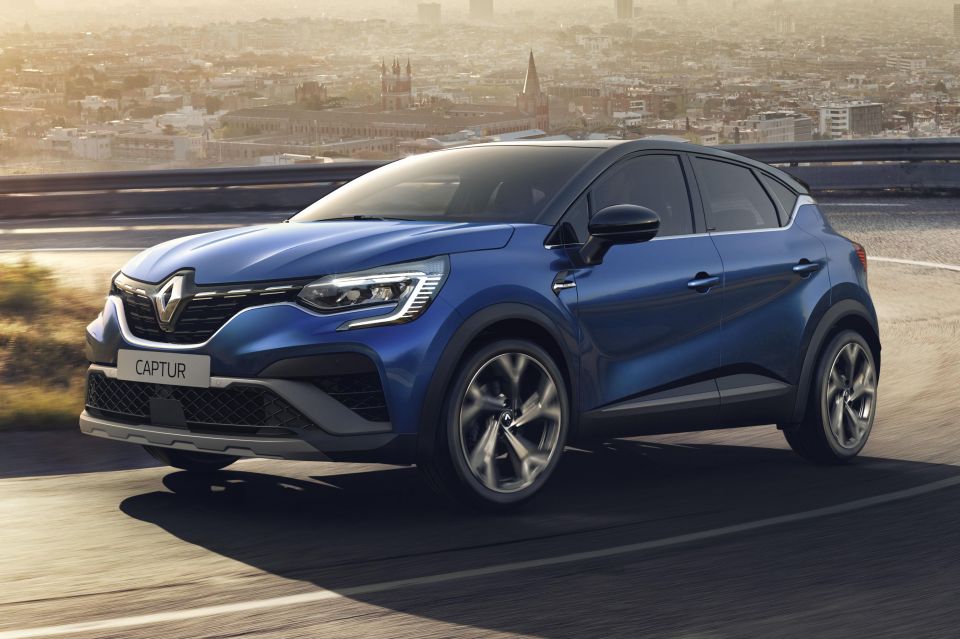
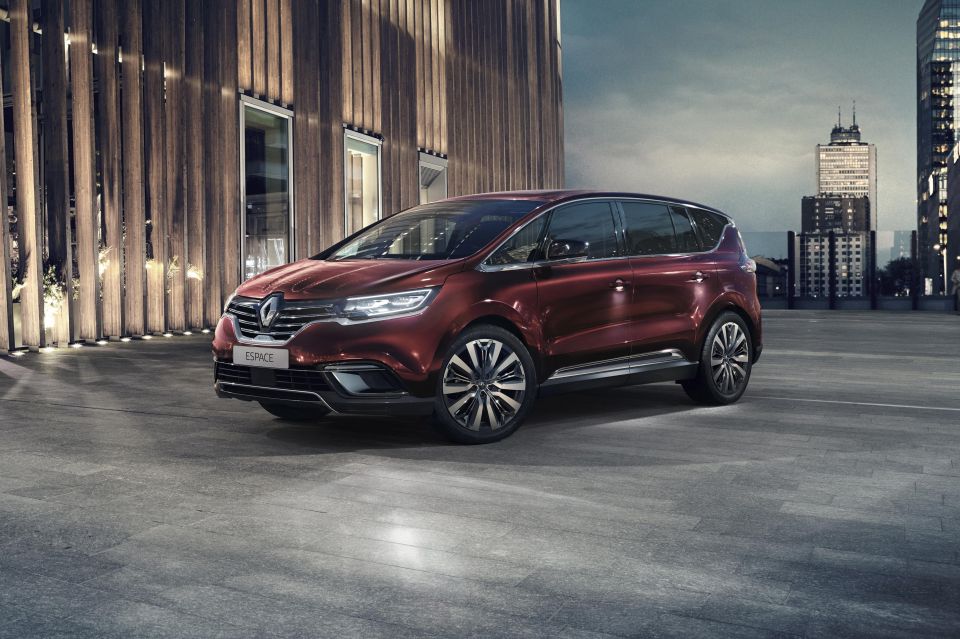
With 7,782,783 sales across all three companies, the Alliance managed to keep a place on the podium, but the sales decline of 23.2 per cent is significantly steeper than those suffered by its rivals.
| Sales | Change from 2019 | |
|---|---|---|
| Nissan Motor | 4,012,934 | -22.5 per cent |
| Groupe Renault | 2,949,849 | -21.3 per cent |
| – Renault | 1,787,121 | -24.1 per cent |
| – Dacia | 520,765 | -29.2 per cent |
| – Lada | 383,983 | -7.0 per cent |
| – Jinbei, Huasong | 156,331 | -3.4 per cent |
| – Renault Samsung Motors | 90,300 | +14.2 per cent |
| – Alpine | 1,526 | -68.4 per cent |
| Mitsubishi Motors | 820,000 | -33.1 per cent |
The only brand in the Renault Group stable to grow last year was Renault Samsung Motors. Its range of locally-produced, Renault-derived models grew along with the rest of the South Korean market, but is still a long way behind compatriots Hyundai, Kia, and Genesis.
In another positive note, Renault claims it was the number one brand in Europe for electric cars during 2020 with 115,888 sales. The Zoe hatch, up 114 per cent to 100,657 sales, made up the bulk of sales, with the Kangoo Z.E. van accounting for the remainder.
It should be noted the Volkswagen Group sold more EVs in Europe in 2020, but its sales were split across several marques. Given the ramp up in production of the ID.3 and introduction of the ID.4, it’s likely Renault will be unable to hold onto its electric crown.
| Groupe Renault Rengion | Sales | Change from 2019 |
|---|---|---|
| Western Europe | 1,443,917 | -25.8 per cent |
| – France | 535,591 | -23.3 per cent |
| Eastern Europe | 743,519 | -0.7 per cent |
| – Russia | 480,742 | N/A |
| – Romania | 59,180 | N/A |
| Africa, Middle East, India, Pacific | 346,207 | -23.3 per cent |
| – Australia | 6911 | -20.3 per cent |
| Latin America | 260,478 | -38.6 per cent |
| China | 155,728 | -13.3 per cent |
In its homeland, Renault took a 26.1 per cent share of the new car market. Russia was the company’s second largest single country market, with the firm securing a 30.1 per cent share, and Lada still the nation’s most popular marque on 21.5 per cent.
The French automaker was also the dominant force in Romania (40.5 per cent) and Morocco (41.1 per cent) thanks to Dacia, and its manufacturing presence in both countries.
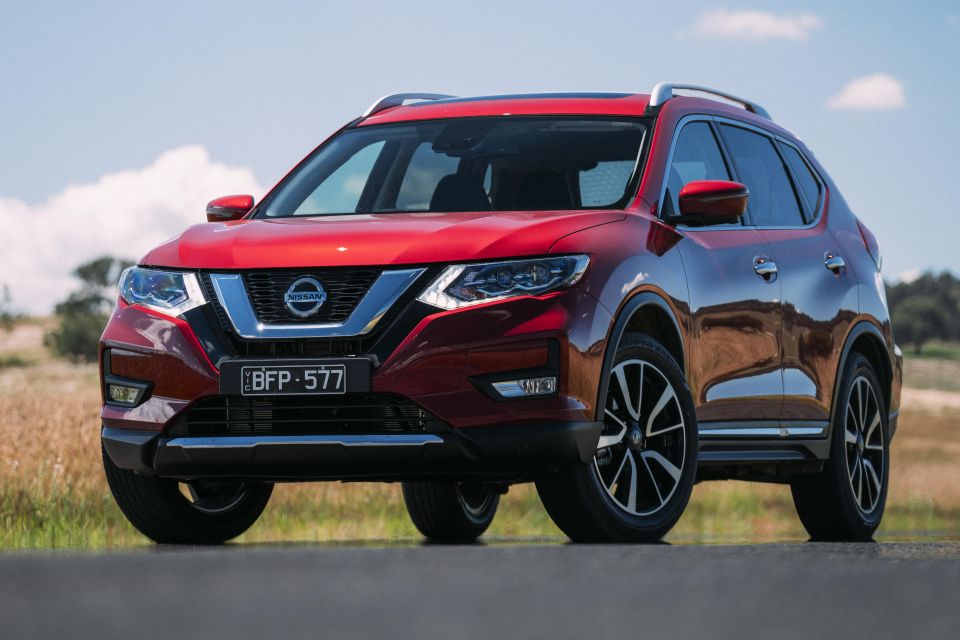
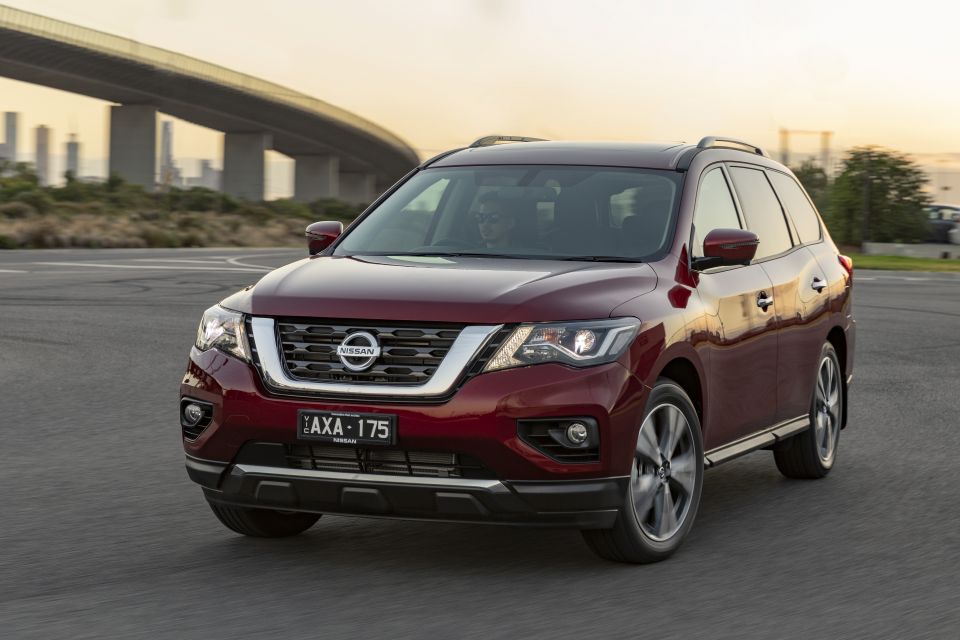
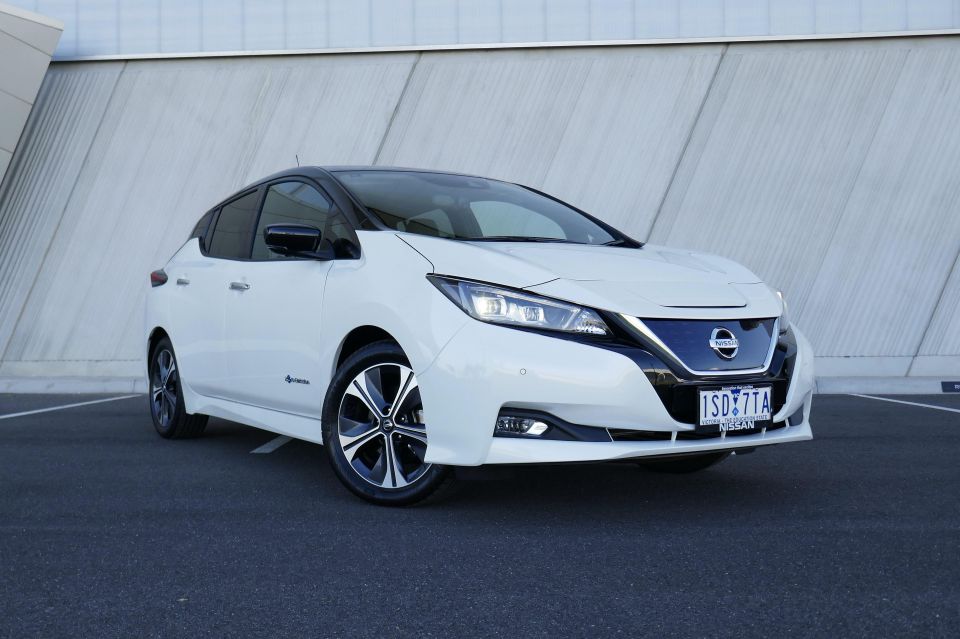
Unfortunately Nissan doesn’t break down its sales by brand, but we do know Datsun is being shut down and Infiniti sold 79,502 cars in the USA last year, a fall of 32.5 per cent – or roughly a quarter of what Lexus managed there.
Nissan’s strengths largely lie where Renault is weakest (China) or not present (the US and Canada).
| Nissan Region | Sales | Change from 2019 |
|---|---|---|
| China | 1,456,738 | -5.8 per cent |
| North America | 1,183,778 | -32.4 per cent |
| – USA | 899,217 | -33.2 per cent |
| Japan | 468,518 | -17.5 per cent |
| Europe | 406,235 | -28.3 per cent |
| – Russia | 73,016 | -19.7 per cent |
| Latin America | 140,497 | N/A |
| Middle East | 118,208 | N/A |
| Australia | 38,520 | -24.7 per cent |
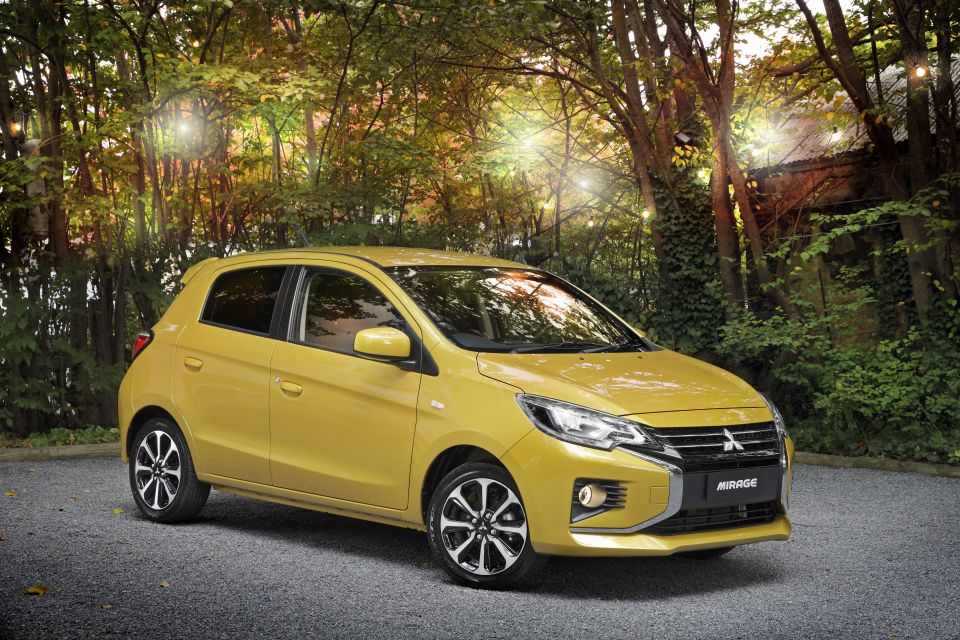
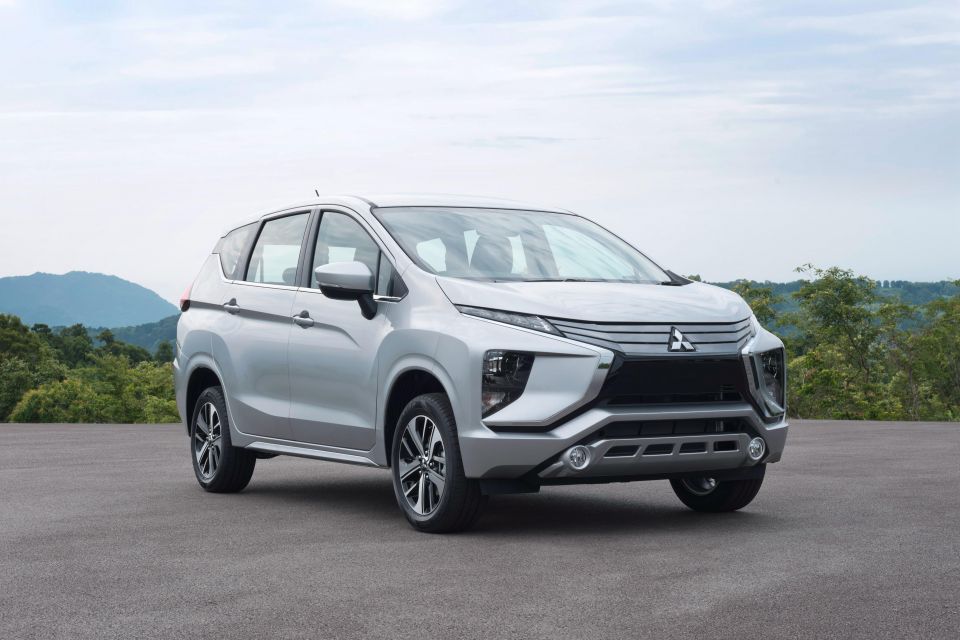
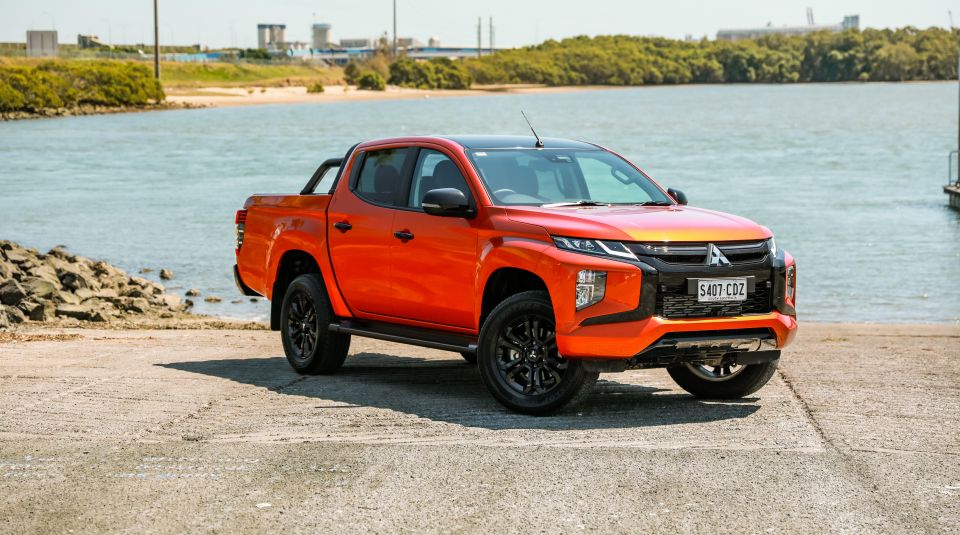
Mitsubishi had a particularly rough year with its 820,000 sales, a steep 33.1 per cent decrease from the 1.23 million it notched up in 2019.
A lot of this can be attributed to the company’s reliance on developing markets, which registered some of the biggest drops.
Unlike other automakers, Mitsubishi did not benefit from a bounce in the Chinese economy after it relaxed its strict Coronavirus restrictions.
| Mitsubishi Region | Sales | Change from 2019 |
|---|---|---|
| Asia | 291,000 | -39.0 per cent |
| – China | 80,000 | -43.7 per cent |
| – Thailand | 57,000 | -35.2 per cent |
| – Indonesia | 55,000 | -53.8 per cent |
| Europe | 164,000 | -28.7 per cent |
| North America | 120,000 | -29.4 per cent |
| Japan | 70,000 | -32.7 per cent |
| Australia, New Zealand | 69,000 | -28.9 per cent |
| – Australia | 58,335 | -30.0 per cent |
| Middle East, Africa | 64,000 | -25.6 per cent |
| Latin America | 42,000 | -32.3 per cent |
When the Alliance revealed its leader-follower model – with regions around the world assigned one manufacturer to be the focal point – it wasn’t surprising to see Mitsubishi designated as the lead for Australia/New Zealand.
The brand sells just a tick over 51 per cent more vehicles here than Nissan, and almost 8.5 times the number moved by Renault and Alpine.
Mitsubishi’s subsequent ‘Small but Beautiful’ turnaround plan saw it focus its efforts in the Asia Pacific region, which accounts for more than 52 per cent of its sales.
The automaker announced it would commence its withdrawal from its second largest geographic region, Europe.
Mitsubishi has since changed its mind and will stay on the Continent, although most of its future range will be produced by Renault.
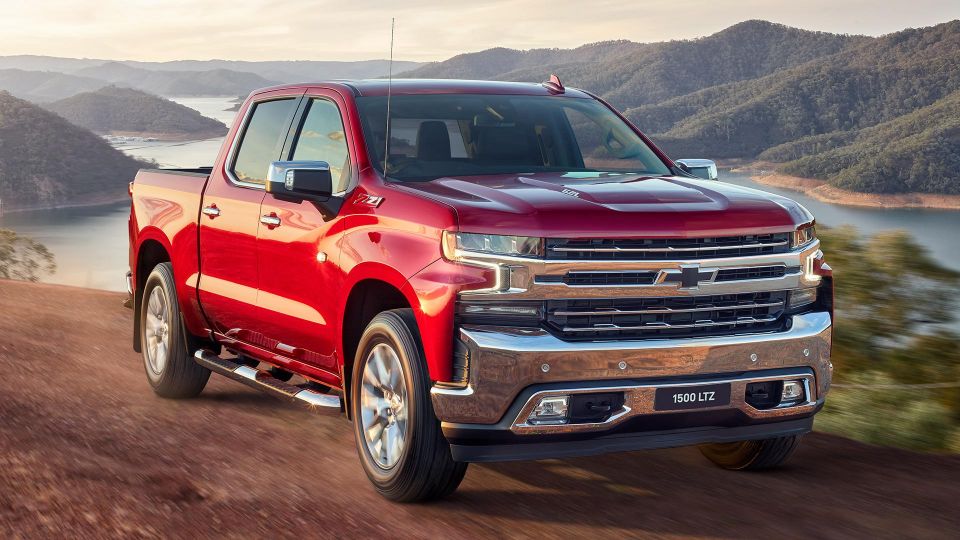

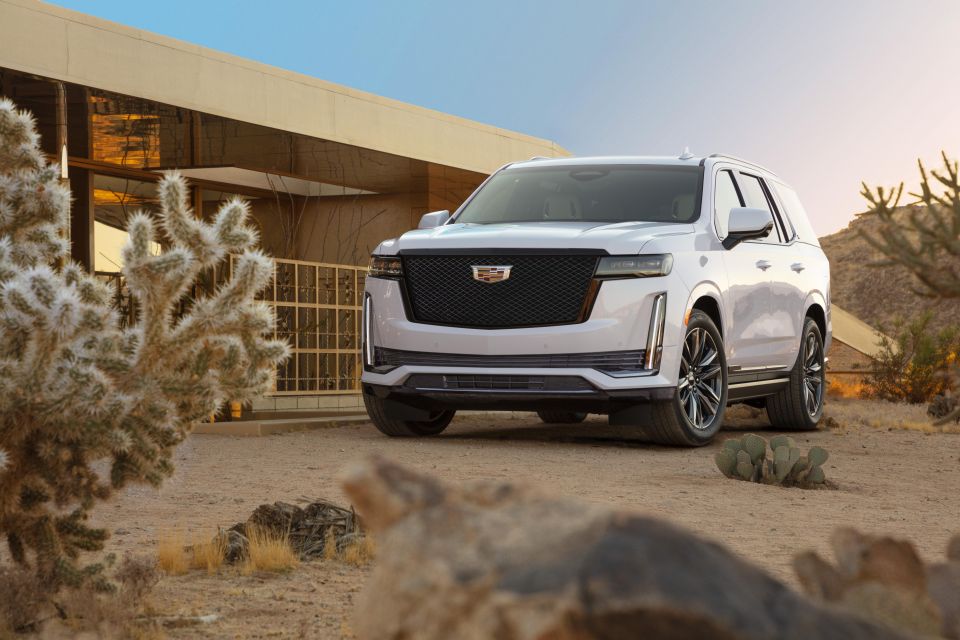
Last year GM shrank its global footprint a little further by quitting its remaining right-hand drive markets, including Australia and Thailand.
As a result of this and the Coronavirus pandemic, sales fell from 7,718,000 in 2019 to 6,829,000 in 2020, a drop of 11.5 per cent.
Combined with the company’s earlier departure from Europe, with the sale of Opel/Vauxhall to the PSA Group, The General’s fortunes are increasingly tied to the wellbeing of the USA and China.
The two countries account for 5,447,000 of its sales, or 79.8 per cent.
| Region | Sales | Change from 2019 |
|---|---|---|
| North America | 2,924,000 | -13.2 per cent |
| – US | 2,547,000 | -11.8 per cent |
| China | 2,901,000 | -6.2 per cent |
| South America | 470,000 | -29.8 per cent |
| – Brazil | 338,000 | -29.0 per cent |
| Rest of the world | 533,000 | -8.9 per cent |
| – Australia | 43,176 | -61.3 per cent |
While the days of GM accounting for half of car sales in the US are gone, its 17.0 per cent market share gives it the number one spot.
It also enjoys a healthy 11.6 per cent share of the new car market in China, and a 16.3 per cent share in Brazil.
Chevrolet is also the number one brand in South America.
| US brand | Sales | Change from 2019 |
|---|---|---|
| Chevrolet | 1,739,000 | -11.2 per cent |
| GMC | 516,000 | -8.7 per cent |
| Buick | 163,000 | -21.3 per cent |
| Cadillac | 129,000 | -17.3 per cent |
The company also broke down its sales by brand for two markets: the USA, and a large group encompassing the Asia Pacific, Middle East, and Africa.
Pickup trucks accounted for 876,000 or 50.4 per cent of Chevrolet’s US sales, while crossovers amounted to 652,000 or 37.5 per cent.
Traditional body style sales fell 38.2 per cent to just 211,000. Last year the Impala and Sonic exited showrooms, leaving just the Spark and Malibu behind.
| Asia Pacific, Middle East and Africa brand | Sales | Change from 2019 |
|---|---|---|
| Wuling | 1,102,000 | +7.5 per cent |
| Buick | 885,000 | +4.1 per cent |
| Chevrolet | 764,000 | -14.8 per cent |
| Baojun | 402,000 | -33.9 per cent |
| Cadillac | 237,000 | +7.2 per cent |
| Other (includes GMC, Holden) | 44,000 | -42.9 per cent |
| – Holden | 16,688 | -61.3 per cent |
It should be noted the figures for the combined Asia, Middle East, and African market is dominated by China, which accounts for 84.5 per cent of the 3,434,000 aggregated sales.
Buick, Cadillac, and small van and people mover specialist Wuling all benefitted from China’s bounce back after its harsh Coronavirus lockdown measures.
Baojun and Chevrolet, however, did not benefit to the same degree, although Chevrolet’s figures may be weighed down by sales dips in other countries as it is GM’s main brand outside of China.
| Sales | Change from 2019 | |
|---|---|---|
| Hyundai/Genesis | 3,612,287 | -15.4 per cent |
| Kia | 2,607,337 | -5.9 per cent |
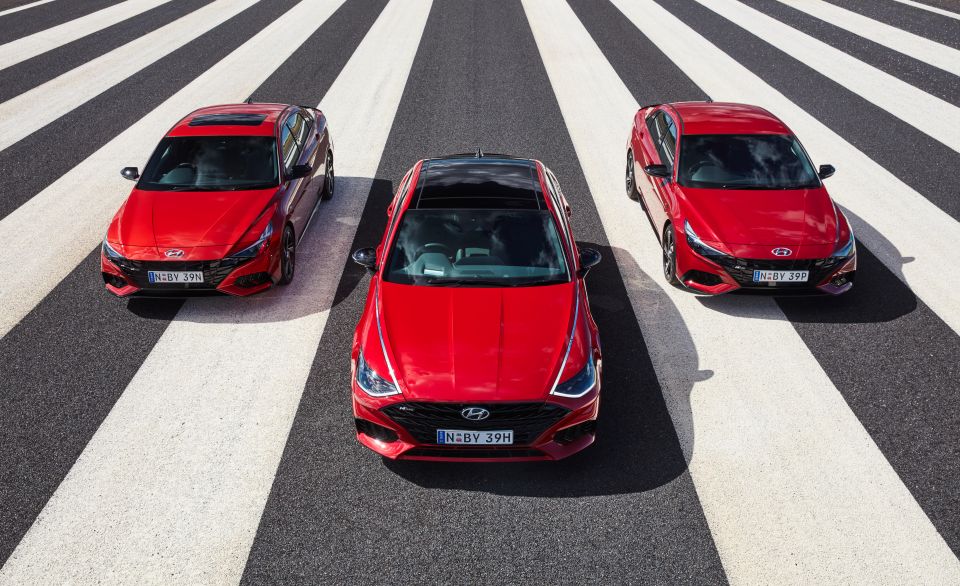
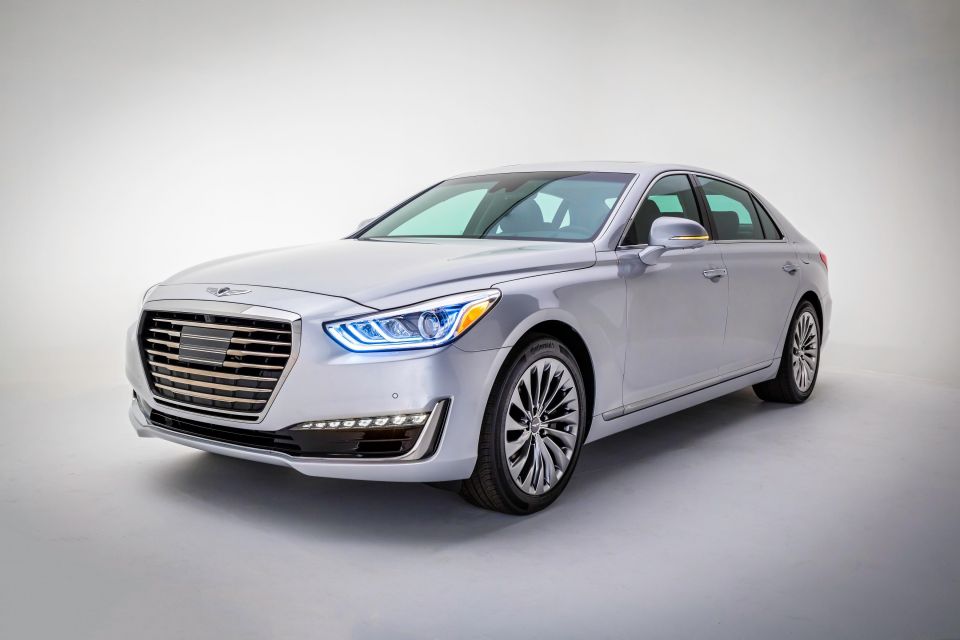
The South Korean automaker sold 6,352,074 vehicles across its three brands in 2020, a fall of 11.7 per cent.
Genesis, the company’s luxury marque, sold 132,450 vehicles across the world in 2020 with the majority (81.8 per cent) attributed to buyers in South Korea.
In most markets Hyundai is the better-selling brand, although Kia was more popular in Europe by around 11,000 units.
| Hyundai | Genesis | Kia | |
|---|---|---|---|
| South Korea | 679,470 | 108,384 | 520,205 |
| US | 622,269 | 16,384 | 586,105 |
| Europe | 405,698 | 0 | 416,715 |
| Australia | 64,807 | 229 | 56,076 |
As with many other carmakers, Hyundai/Genesis saw its sales grow in South Korea, with the combined tally for both brands rising 6.2 per cent to 787,854.
Automotive trivia nerds will be interested to know Hyundai’s most popular model in its home market was the Grandeur large sedan (145,463).
It was followed by the Avante/Elantra (87,731), Sonata (67,440) and Palisade (64,791). The Genesis G80 (53,183) rounded out unit’s top five.
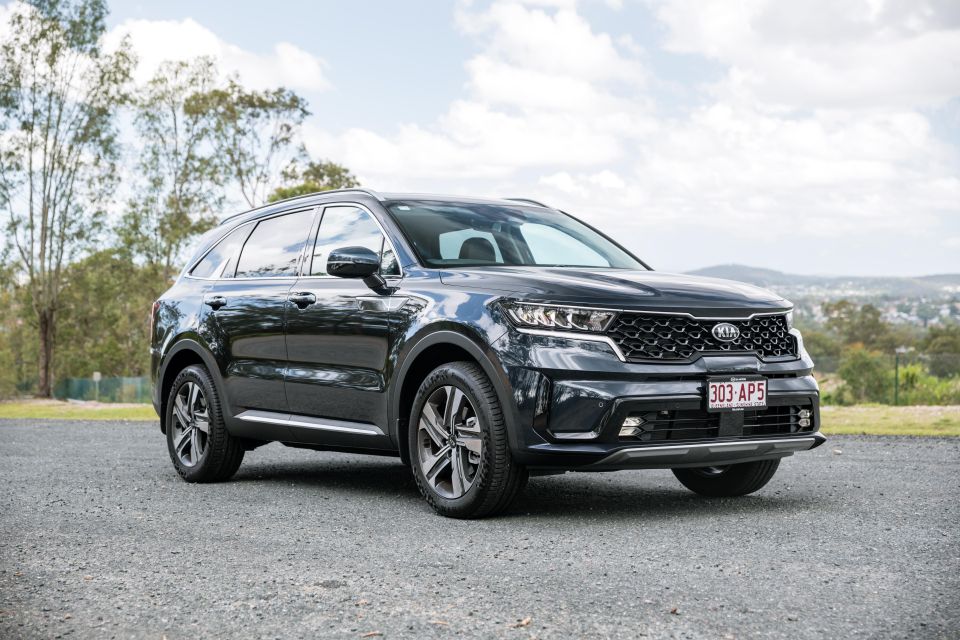
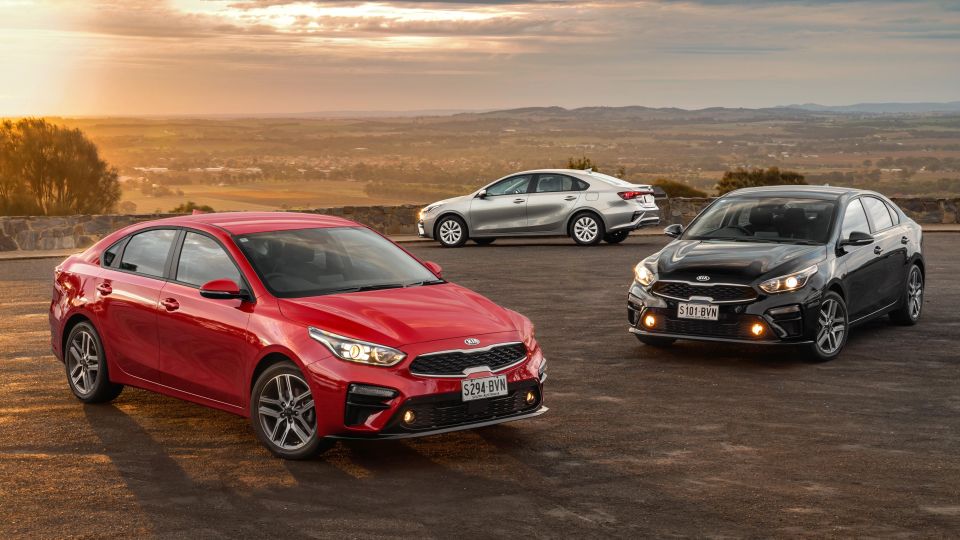
Thanks to increased sales in South Korea, the overall figure at Kia was only down 5.9 per cent across the globe.
Globally the Sportage (366,929) was Kia’s most popular model, with the Seltos (328,128) and K3/Cerato/Forte (237,688) taking the podium places.
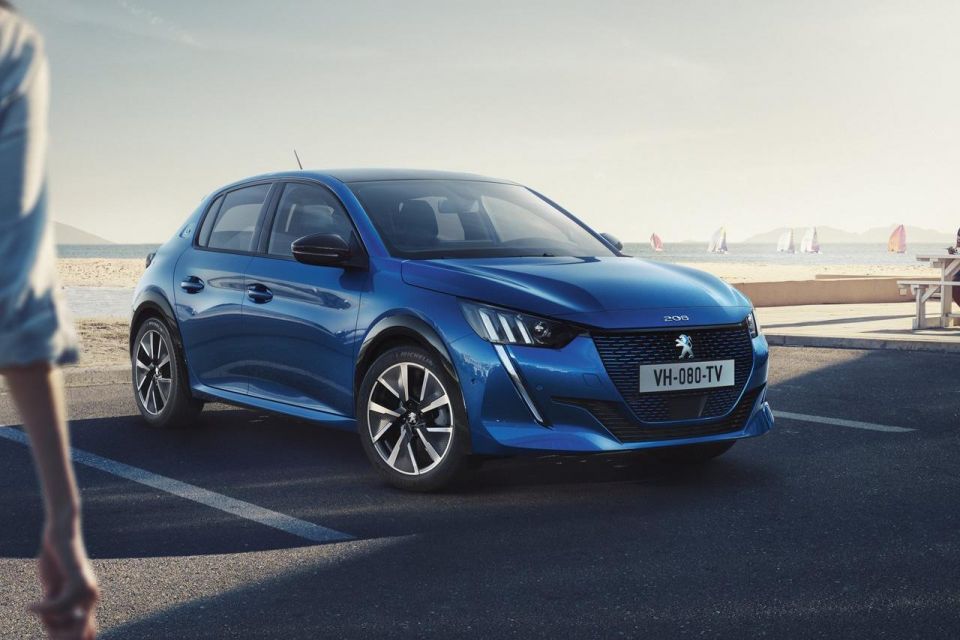
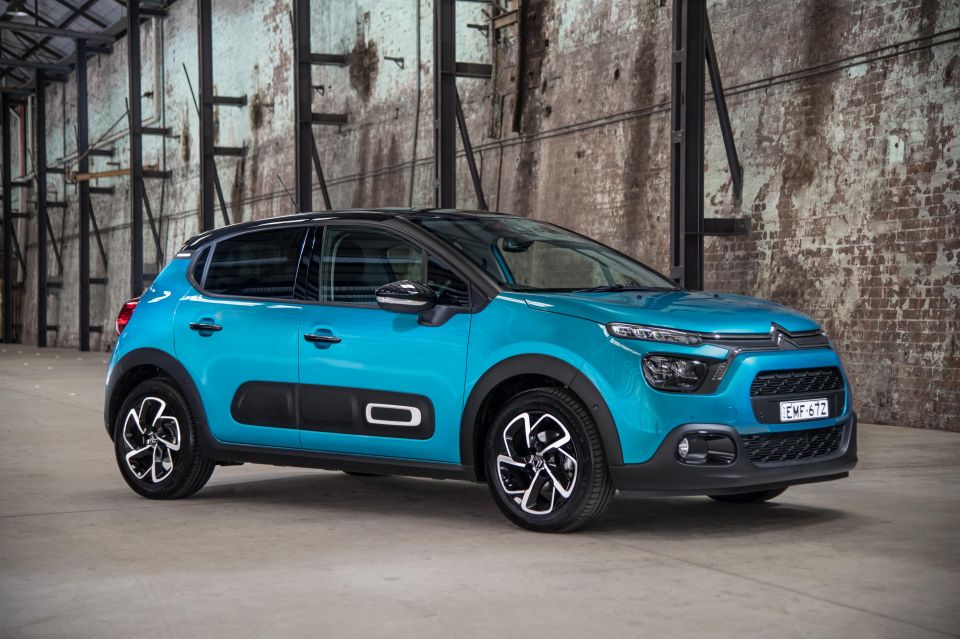
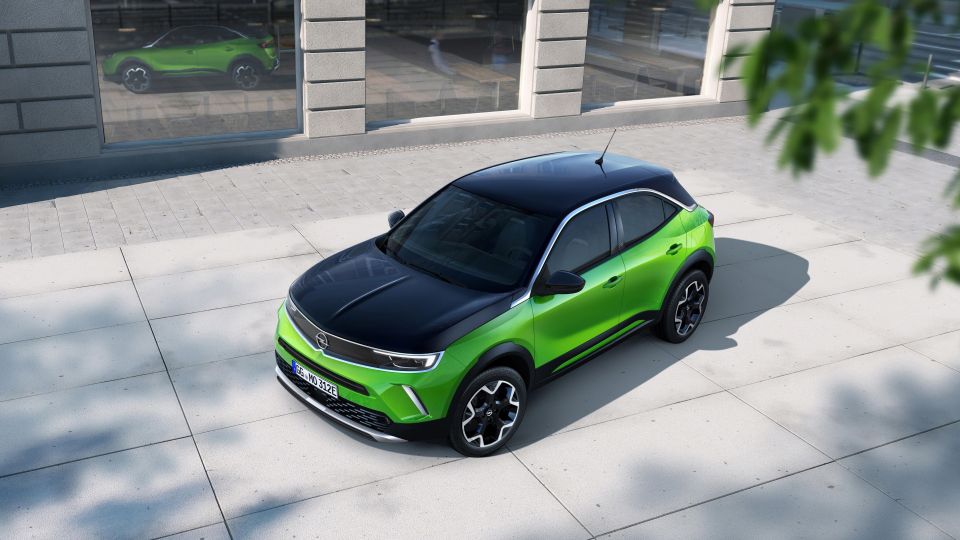
When Fiat Chrysler (FCA) and Groupe PSA announced their intention to merge in late 2019, the combined company was set to become the world’s fourth-largest automaker.
In January 2021, FCA and PSA tied the knot to become Stellantis. But instead of starting in the number four slot, the new firm starts its life in sixth place with combined sales of around 6.25 million vehicles in 2020.
Like other manufacturers, both FCA and PSA saw big declines as the Coronavirus pandemic closed factories, disrupted supply chains, and forced people to stay home.
Unlike many other automakers, though, neither FCA or PSA has a significant presence in China, the first major power to get the pandemic under control.
| Sales | Change from 2019 | |
|---|---|---|
| Fiat Chrysler | 3,743,000 | -17.7 per cent |
| Groupe PSA | 2,512,475 | -27.8 per cent |
Fiat Chrysler’s strength is in North America, which not only accounts for 55 per cent of sales, but practically of all of its profit.
While FCA is able to earn billions in profit in North America, its European arm struggles to make millions as its range is skewed towards light vehicles.
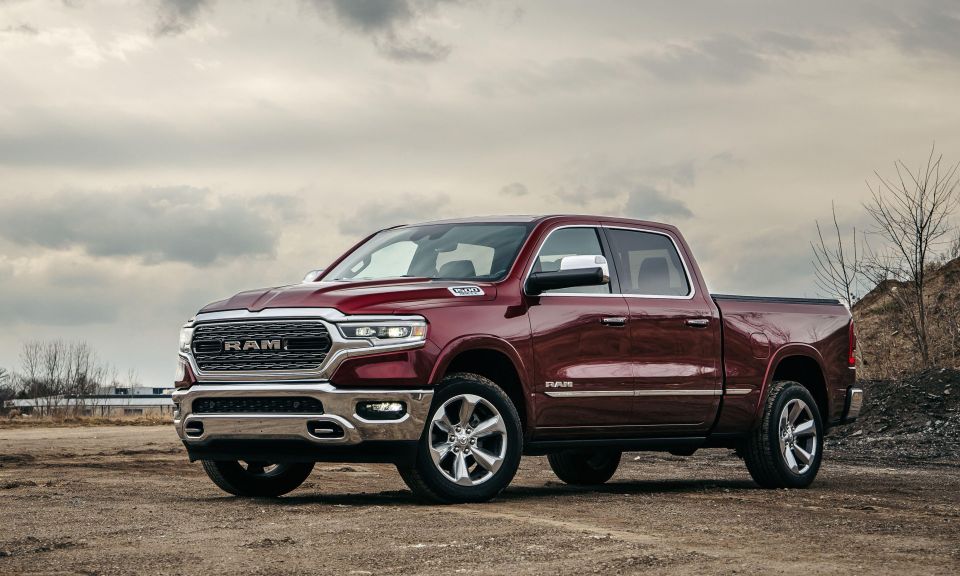
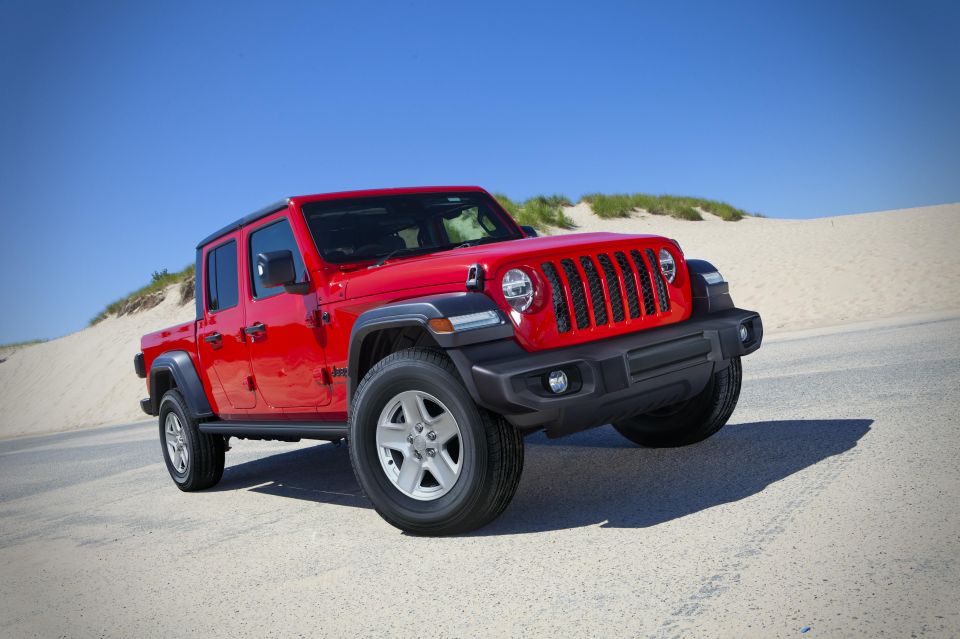
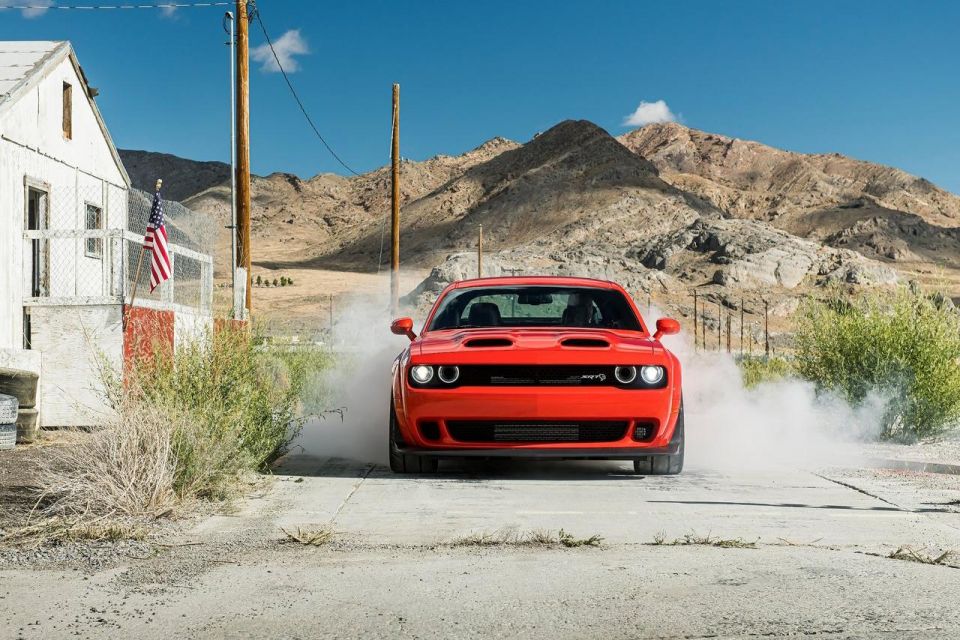
In the US market, Jeep (795,313) was the company’s top brand, ahead of Ram (624,642), Dodge (267,328), Chrysler (110,464), Alfa Romeo (18,586), and Fiat (4303).
Importantly, the company’s best selling vehicles in the US also have healthy profit margins: Ram pickup (563,676), Jeep Grand Cherokee (209,786), and Jeep Wrangler (201,311).
| FCA Region | Sales | Change from 2019 |
|---|---|---|
| North America | 2,049,000 | -18 per cent |
| Europe, Middle East & Africa | 1,083,000 | -18 per cent |
| Latin America | 503,000 | -13 per cent |
| Asia Pacific | 108,000 | -29 per cent |
| – Australia | 11,967 | -5.4 per cent |
As for the other half of Stellantis, a tick over 85 per cent of Groupe PSA’s sales come from Europe.
| PSA Region | Sales | Change from 2019 |
|---|---|---|
| Europe | 2,123,493 | -29.7 per cent |
| Middle East & Africa | 197,119 | +20.0 per cent |
| Latin America | 95,357 | -29.7 per cent |
| China | 45,965 | -57.7 per cent |
| India & Asia Pacific | 32,752 | -6.6 per cent |
| – Australia | 2332 | -18.0 per cent |
| Eurasia | 17,789 | +13.7 per cent |
Unfortunately FCA doesn’t break down sales by brand on a global level, but it’s probably safe to assume Jeep vies for top spot with Peugeot, while Ram sits somewhere between Citroen and Opel/Vauxhall.
| Sales | Change from 2019 | |
|---|---|---|
| Peugeot | 1,118,912 | -23.0 per cent |
| Citroen | 717,190 | -27.5 per cent |
| Opel/Vauxhall | 632,687 | -35.0 per cent |
| DS | 43,686 | -29.5 per cent |
| Maserati | 17,200 | -35 per cent |
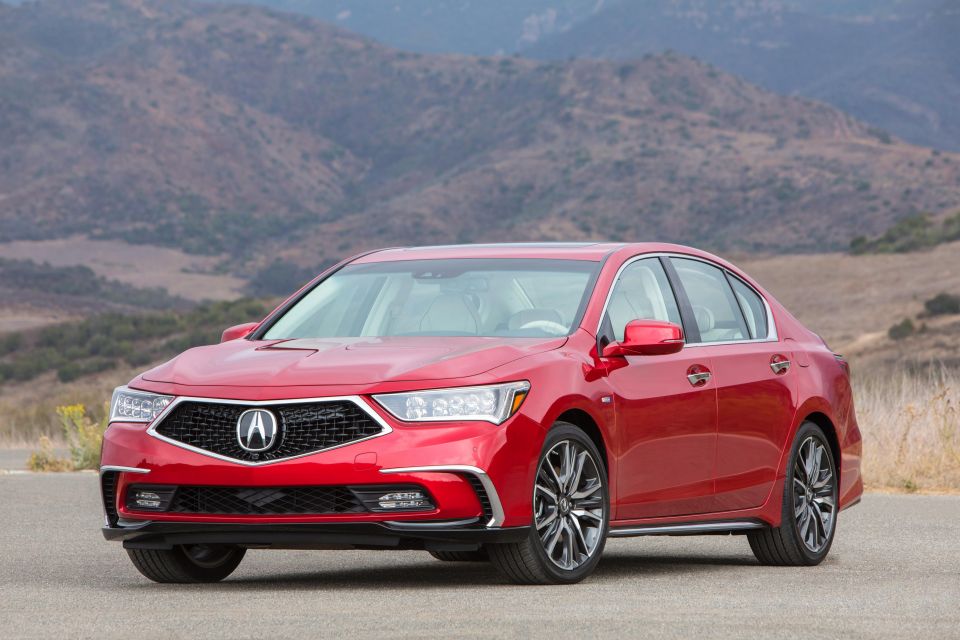
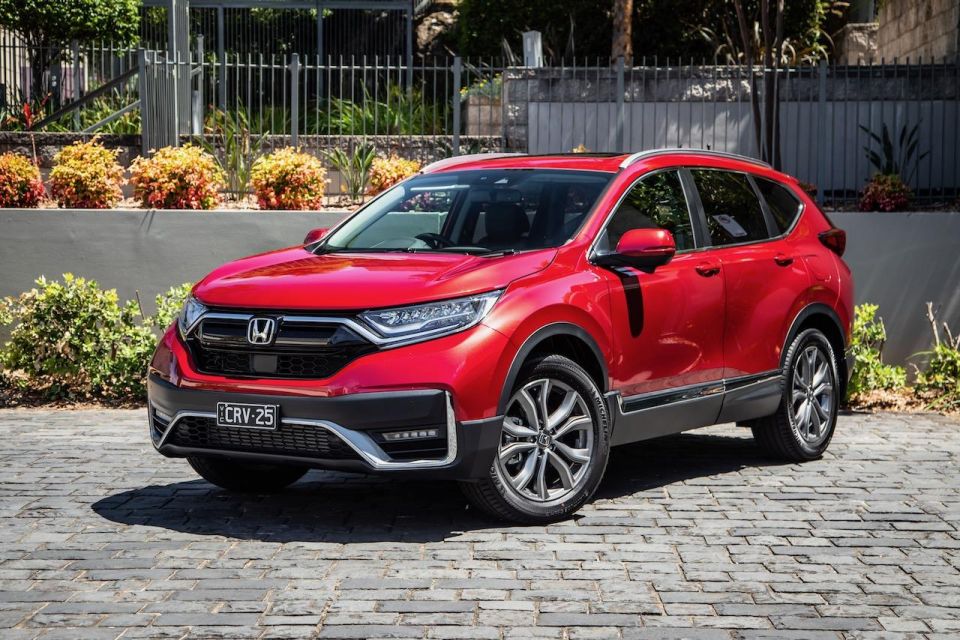
Overall, Honda’s sales were down 14.8 per cent last year to 4,406,000 – from 5,173,000 in 2019.
Thanks to “various consumption stimulation measures” sales in China rose during the year, despite taking a knock in the first quarter due to Coronavirus restrictions.
Although sales dipped in Japan due to the pandemic, Honda’s N-Box range was once again top of the pops, retaining its kei car crown for the sixth year and overall honours for the fourth.
Acura, which counts North America and China as its main markets, doesn’t have its figures broken out in Honda’s global reports.
According to numbers published in the US, the luxury division sold 136,982 cars there in 2020. Although it sells half as many vehicles as Lexus, it is still comfortably ahead of Infiniti.
| Sales | Change from 2019 | |
|---|---|---|
| Asia (ex. Japan) | 2,038,000 | -6.9 per cent |
| North America | 1,521,000 | -20.5 per cent |
| Japan | 601,000 | -13.3 per cent |
| Europe | 107,000 | -29.1 per cent |
| Other | 139,000 | -38.8 per cent |
Honda Motorcycles suffered a bigger fall than the car division, with sales down a staggering 45.8 per cent from 19,596,000 in 2019 to 10,624,000 in 2020.
With 9.3 million sales, the Asia region, excluding Japan, accounts for 87.6 per cent of all Honda bikes sold. The biggest individual markets are India, Indonesia, Vietnam, Thailand, Pakistan, and the Philippines in order of volume.
The developed markets of North America (250,000), Europe (177,000), and Japan (160,000) only constitute 5.5 per cent of sales.
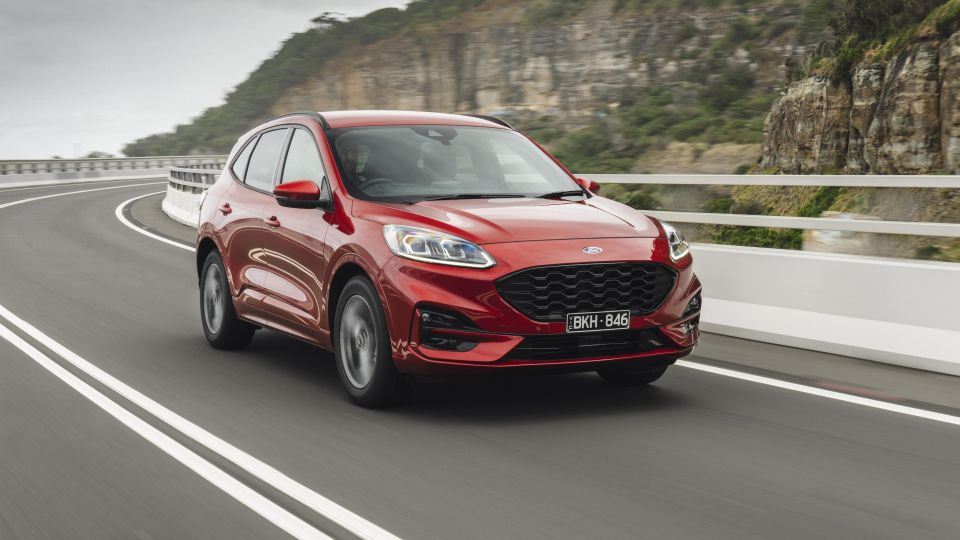
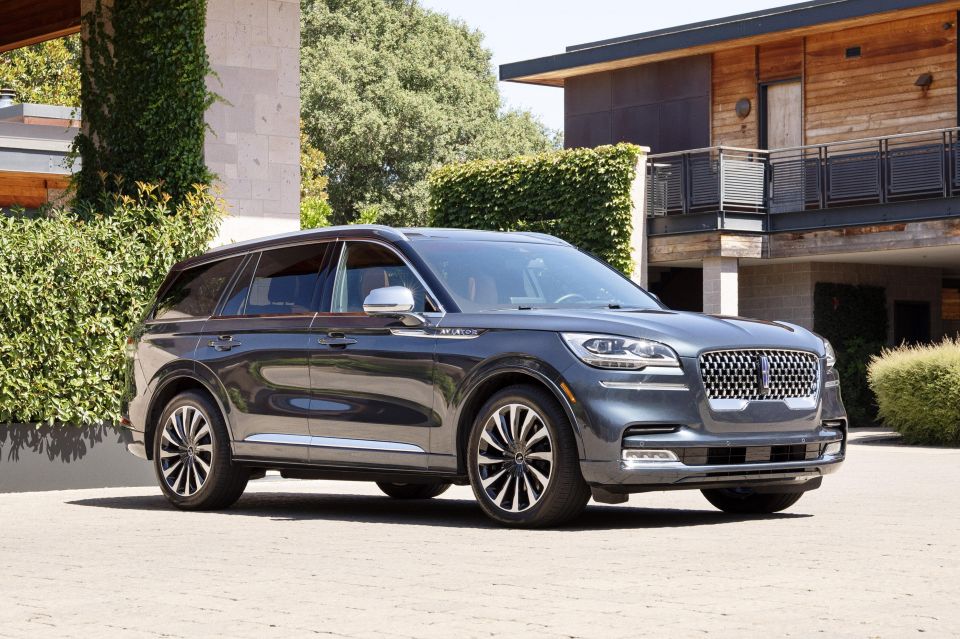
Across its two brands — Ford and Lincoln — the company sold 4,187,000 vehicles in 2020, a drop of 22 per cent from the year prior.
Although the Blue Oval suffered big drops across all regions except China, its market share was pretty much the same as in 2019.
Ford and Lincoln had a combined market share of 13.2 per cent in North America, the company’s most commanding market position.
It also enjoys healthy shares in Europe and South America, where it holds 7.2 per cent and 6.2 per cent respectively.
Although China could soon overtake Europe as the its second largest market, Ford’s market share there is a mere 2.4 per cent.
| Region | Sales | Change from 2019 |
|---|---|---|
| North America | 2,081,000 | -25 per cent |
| Europe | 1,020,000 | -27 per cent |
| China | 617,000 | +15 per cent |
| South America | 185,000 | -38 per cent |
| Rest of the world | 284,000 | -29 per cent |
| – Australia | 59,601 | -5.8 per cent |
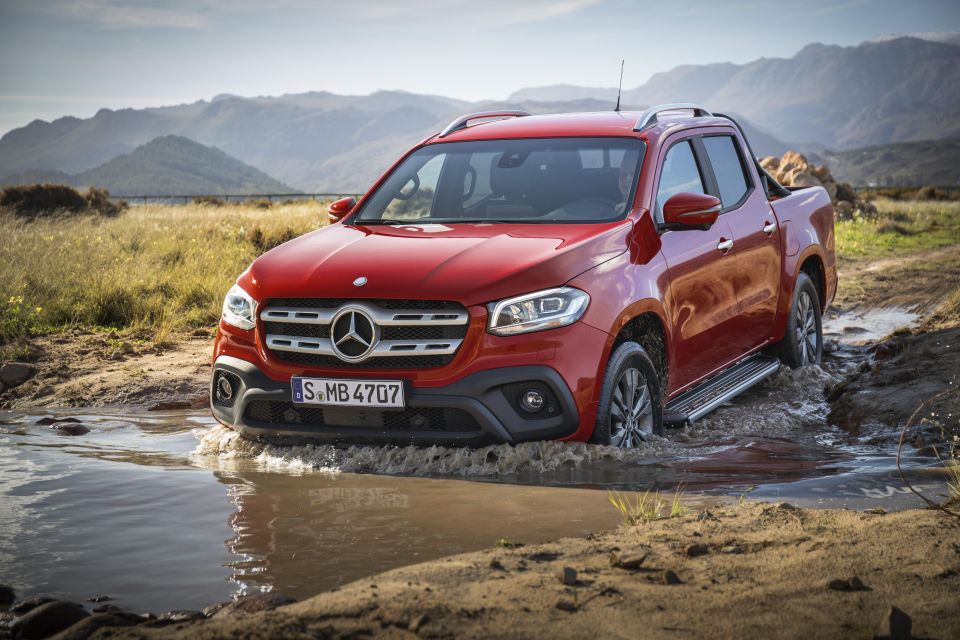
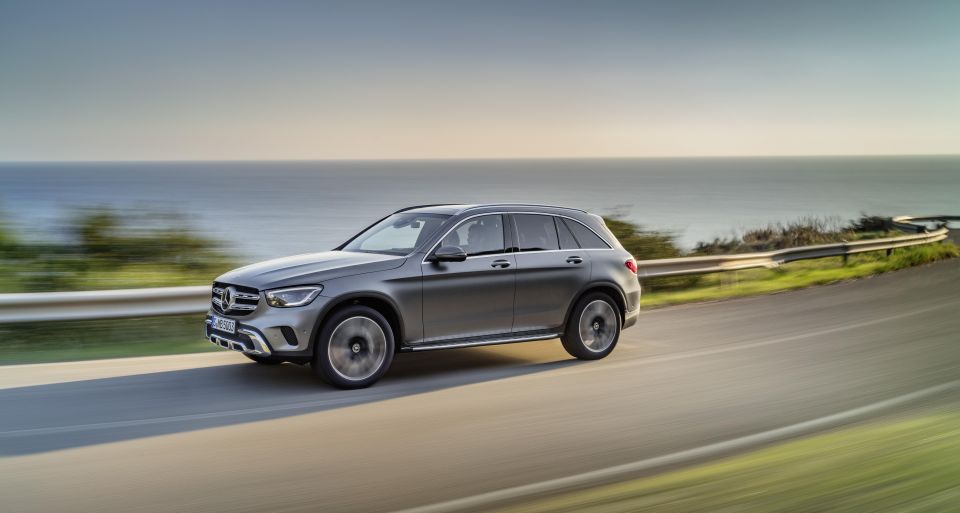
Last year Daimler sold 2,461,884 cars, SUVs and vans, a reduction of 13 per cent from 2019.
The passenger division, consisting of the Mercedes-Benz and Smart marques, was responsible for 2,087,232 sales (-13 per cent), while the commercial vehicle division sold 374,652 units (-15 per cent).
| Sales | Changefrom2019 | |
|---|---|---|
| SUVs | 888,000 | +12 per cent |
| A-Class & B-Class | 449,000 | -15 per cent |
| E-Class | 332,000 | -21 per cent |
| C-Class | 309,000 | -30 per cent |
| S-Class | 56,000 | -25 per cent |
| Smart | 35,000 | -67 per cent |
| Sports cars | 18,000 | -36 per cent |
All the company’s passenger car lines saw falls, except for crossovers. Sadly, Daimler didn’t break down the SUV category further.
Like many other carmakers, Daimler saw growth in China. About 611,000 – or almost 81 per cent – of the company’s sales in the country were locally-made vehicles.
| Sales | Change from 2019 | |
|---|---|---|
| Europe | 784,000 | -21 per cent |
| – Germany | 283,000 | -16 per cent |
| China | 758,000 | +9 per cent |
| US | 249,000 | -20 per cent |
| Rest of the world | 296,000 | -23 per cent |
| – Australia | 29,455 | -7.9 per cent |
While its passenger car sales are broadly spread around the world, the commercial vehicle division relies heavily on Europe.
The unit sold 198,000 Sprinter, 103,000 Vito, 55,000 V-Class, and 13,000 Citan vans last year.
Just 6000 X-Class utes — down from 14,000 in 2019 — found homes after the model was axed part way through the year.
| Sales | Change from 2019 | |
|---|---|---|
| Europe | 245,000 | -18 per cent |
| North America | 55,000 | -2 per cent |
| Asia | 37,000 | -3 per cent |
| Latin America | 12,000 | -37 per cent |
| Rest of the world | 26,000 | -4 per cent |
| – Australia | 6778 | +1.2 per cent |
Daimler Trucks and Buses sold 378,518 vehicles in 2020, a 27 per cent drop from the prior year. The vast majority were trucks (358,349), with buses (20,169) down a significant 38 per cent from 2019.
The company announced recently it will spin off the truck and bus unit as Daimler Trucks and Buses, leaving Mercedes-Benz as a standalone firm.
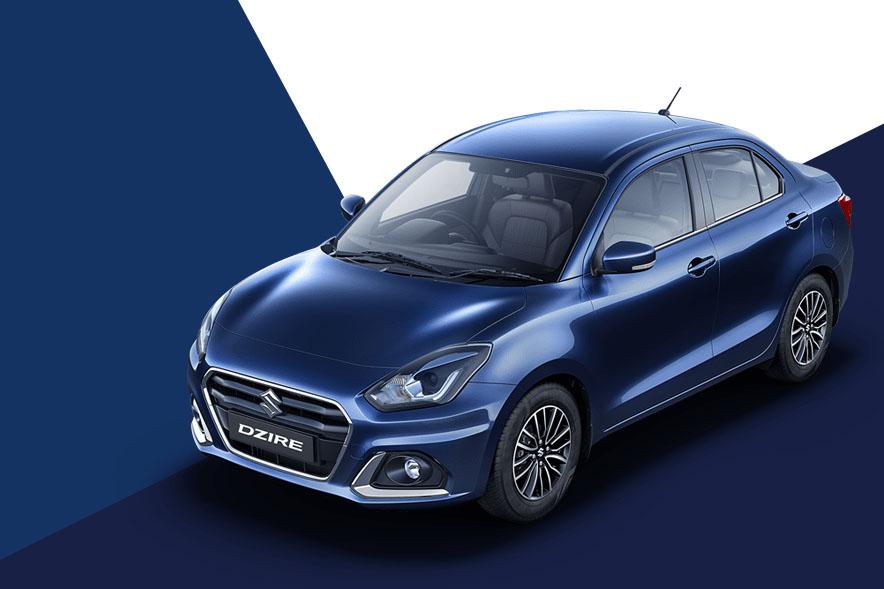
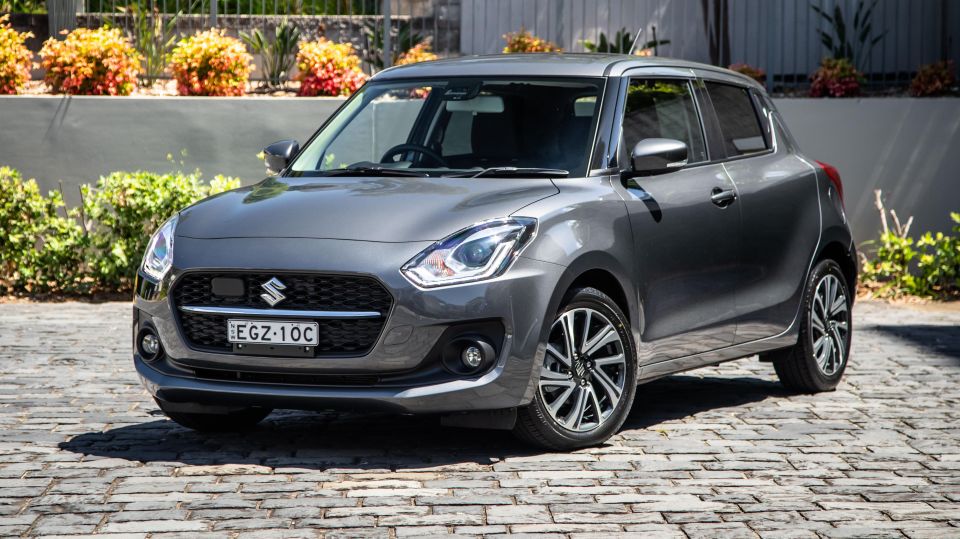
Unless you live in India, Suzuki doesn’t automatically spring to mind as a top 10 force in the automotive world.
But powered in large part by Maruti Suzuki, it sold 2,448,000 vehicles in 2020, a fall of 11.6 per cent from the prior year.
Maruti Suzuki continues to enjoy over 50 per cent market share in the world’s second most populous nation, and accounted for 50.5 per cent of Suzuki’s global sales.
With Japan responsible for a further 25.8 per cent of the automaker’s total, Suzuki is heavily dependent on these two countries. Aside from Europe, other key markets include Pakistan (60,000), Indonesia (71,000), and Thailand (26,000).
The automotive side of Suzuki no longer has a presence in China after it dissolved its joint venture with Changan Motors in 2018.
| Sales | Change from 2019 | |
|---|---|---|
| India | 1,236,000 | -18.2 per cent |
| Japan | 631,000 | -9.3 per cent |
| Europe | 197,000 | -32.3 per cent |
| Australia | 15,586 | -10.0 per cent |
In Japan, Suzuki’s numbers are heavily skewed towards the kei car category, responsible for 523,000 sales or 82.9 per cent.
The company also produces kei cars for other brands, such as the Mazda Carol which is a rebranded Suzuki Alto. Suzuki is also providing vehicles to Toyota to rebadge for the Indian and African markets, including the Baleno being sold as the Glanza in India and Starlet in South Africa.
These deals accounted for a further 122,000 sales, but they are not part of the company’s total figure of 2.5 million.
In 2020 Suzuki sold 1,642,000 motorcycles, down 6.8 per cent. As with cars, India (651,000) is the company’s largest market, although it only accounts for 39.6 per cent of sales.
That’s because China (335,000), Indonesia (206,000), and the Philippines (167,000) also chip in with significant numbers.
Developed markets, such as Japan (51,000), Europe (44,000) and North America (38,000), only made up a small portion of its two-wheeler sales.
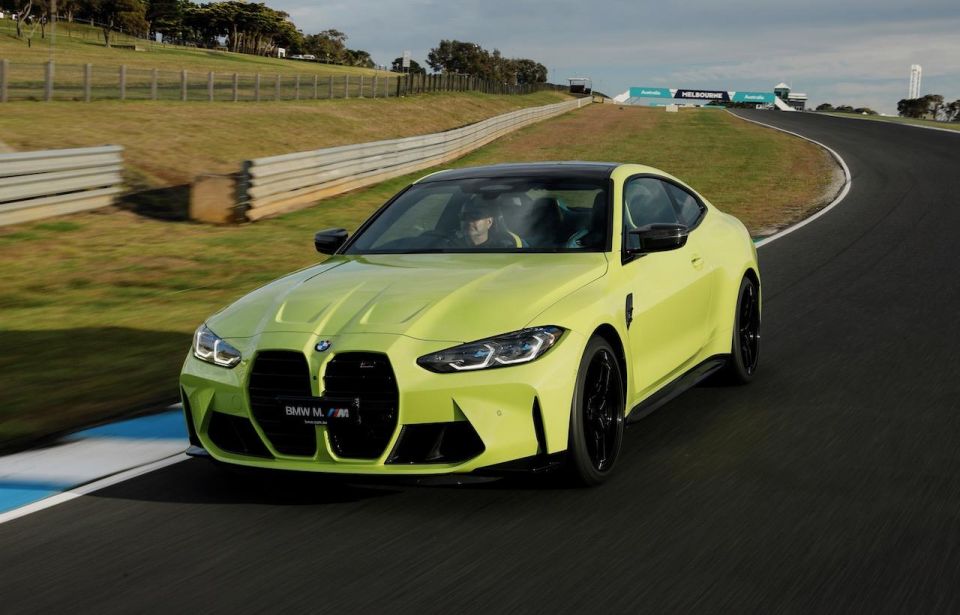
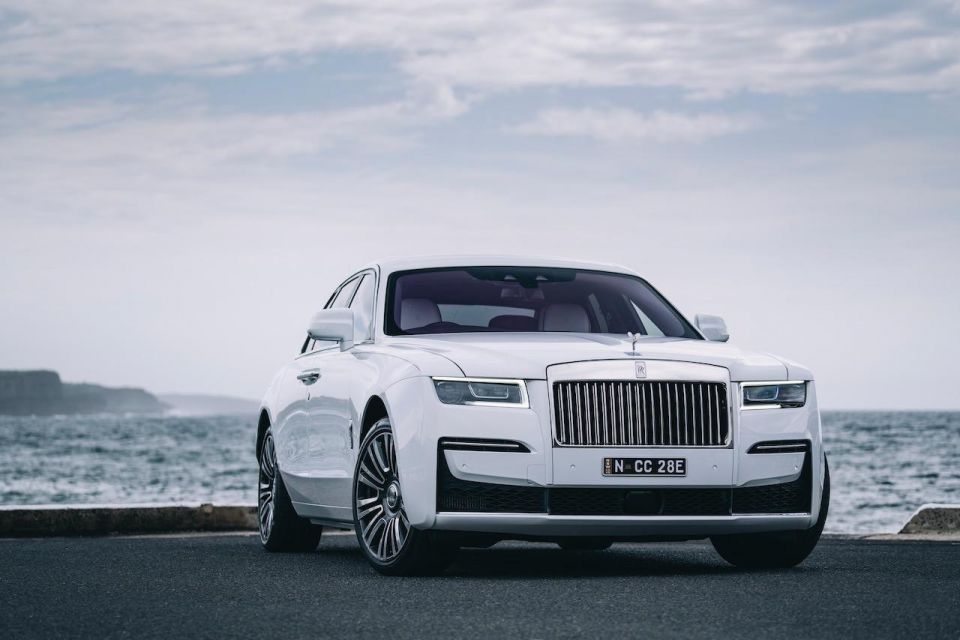
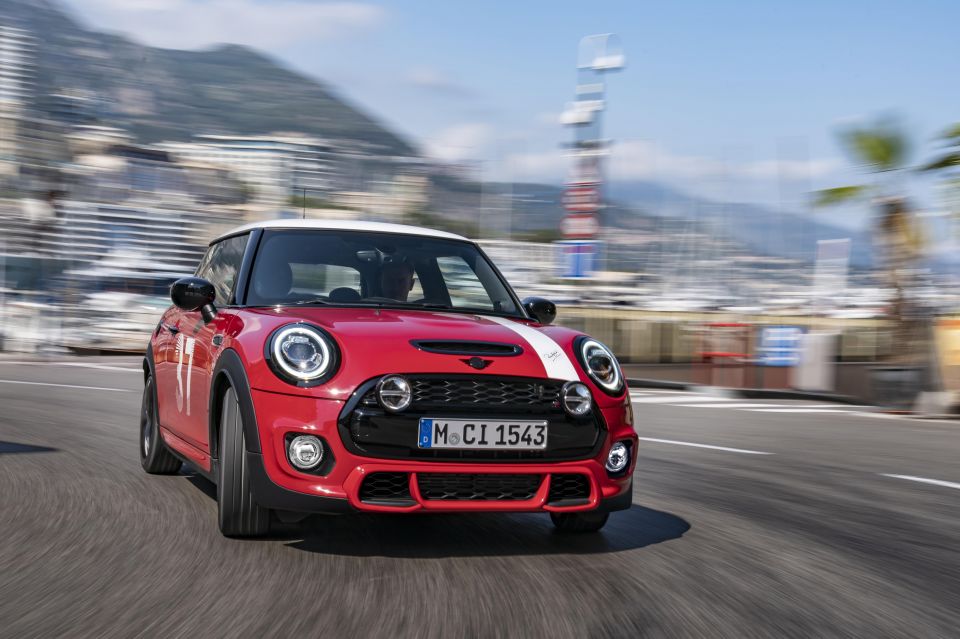
Across its three brands — BMW, Mini and Rolls-Royce — global sales fell 8.4 per cent from 2019 to 2,324,809.
While overall sales for the BMW brand were down, the company was pleased to see sales of its most profitable large vehicles — the 7 Series, 8 Series and X7 — increase 12.4 per cent to 115,420.
| Sales | Change from 2019 | |
|---|---|---|
| BMW | 2,028,659 | -7.2 per cent |
| Mini | 292,394 | -15.8 per cent |
| Rolls-Royce | 3,756 | -26.4 per cent |
Electrified BMW and Mini models accounted for 192,646 of the group’s total figure, up 31.8 per cent from the year before.
The Mini SE, or Mini Electric, accounted for 17,580 of that figure.
The BMW M performance brand sold 144,218 cars and SUVs in 2020, an increase of 5.9 per cent.
| Region | Sales | Change from 2019 |
|---|---|---|
| Europe | 912,621 | -16 per cent |
| – Germany | 287,143 | -13.3 per cent |
| Asia | 984,515 | +6.1 per cent |
| – China | 777,379 | +7.4 per cent |
| – South Korea | 69,872 | +30.5 per cent |
| – Australia | 23,520 | +0.9 per cent |
| USA | 306,870 | -18 per cent |
For those who prefer two wheels to four, BMW Motorrad sold 169,272 motorcycles and scooters in 2020, down 3.4 per cent from 2019, which was the unit’s best-ever year.
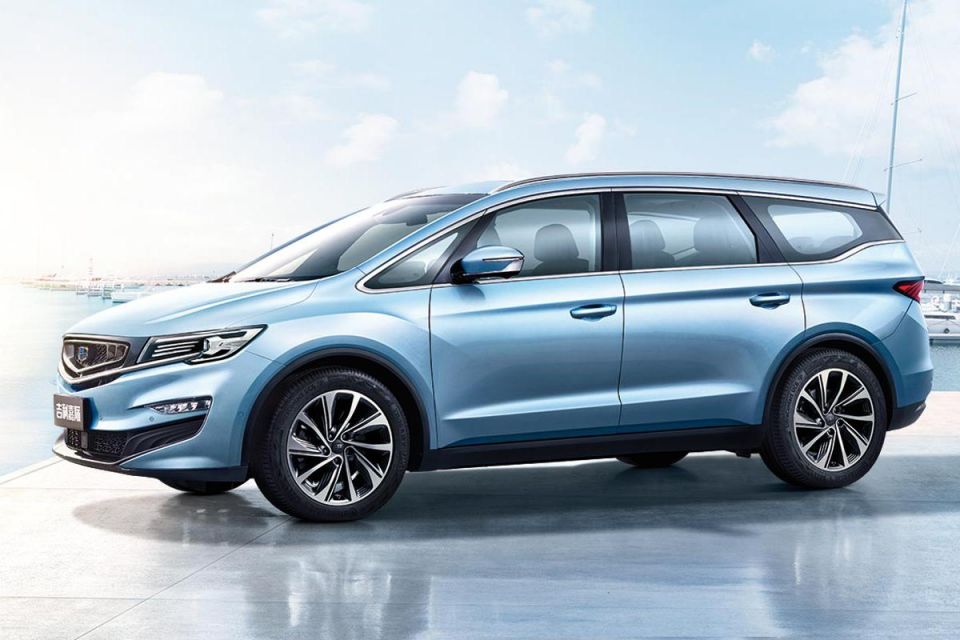
The Geely Group sold at least 2,091,646 vehicles last year. We haven’t been able to obtain figures for Lotus, LEVC, and Polestar, but together these brands should only account for a few thousand vehicles at most.
Out of Geely’s total there were around 180,000 Lynk & Co vehicles. Sitting between Geely and Volvo, Lynk & Co has so far only sold cars in China, although it has opened its first store in Europe.
Only 72,691 or 5.5 per cent of the cars made by Geely or Lynk & Co were exported.
Geely also owns 49 per cent of Proton and 51 per cent of Lotus. Both of these brands recorded sales increases despite the problems caused by the global pandemic.
| Sales | Change from 2019 | |
|---|---|---|
| Geely/Lynk & Co | 1,320,217 | -3 per cent |
| Volvo | 661,713 | -6.2 per cent |
| Proton* | 109,716 | +8.8 per cent |
| Lotus* | N/A | +4.4 per cent |
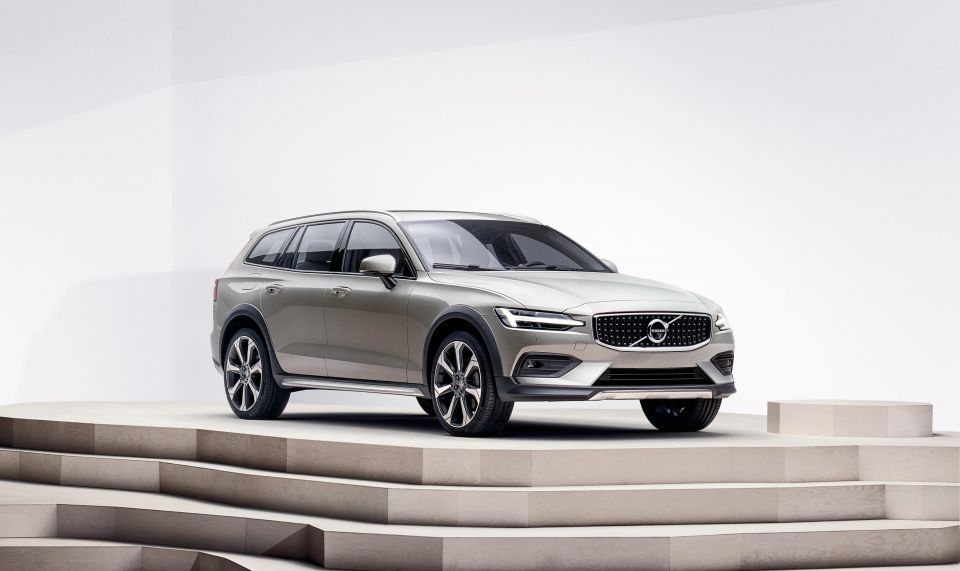
Although Volvo is a luxury marque and an also-ran in much of the world, the brand closed out 2020 as Sweden’s top automotive brand.
In its homeland, Volvo outsold second-place Volkswagen by around 9000 units and doubled third-placed Kia’s tally.
| Region | Sales | Change from 2019 |
|---|---|---|
| Europe | 287,902 | -15.5 per cent |
| – Sweden | 53,701 | -16.1 per cent |
| China | 166,617 | +7.5 per cent |
| USA | 110,129 | +1.8 per cent |
| Rest of the world | 97,065 | -4.5 per cent |
| – Australia | 7,700 | -1.0 per cent |
Crossovers rule much of the world, and Volvo’s model-by-model breakdown reflects this.
SUVs account for 71.0 per cent of Volvo’s global sales, with sedans making up 14.9 per cent and wagons 13.7 per cent.
| Model | Sales | Change from 2019 |
|---|---|---|
| XC60 | 191,696 | -6.5 per cent |
| XC40 | 185,406 | +32.6 per cent |
| XC90 | 92,458 | -8.2 per cent |
| V60 | 64,912 | -5.3 per cent |
| S60 | 52,251 | +22.1 per cent |
| S90 | 46,027 | -18.3 per cent |
| V90 | 25,569 | -37.1 per cent |
| V40 | 3394 | -93.4 per cent |
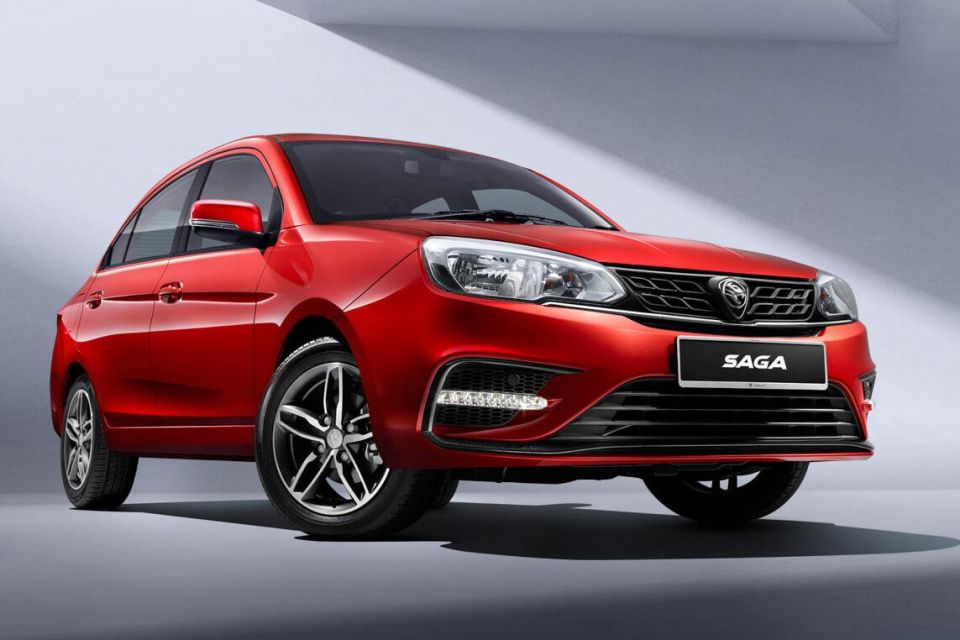
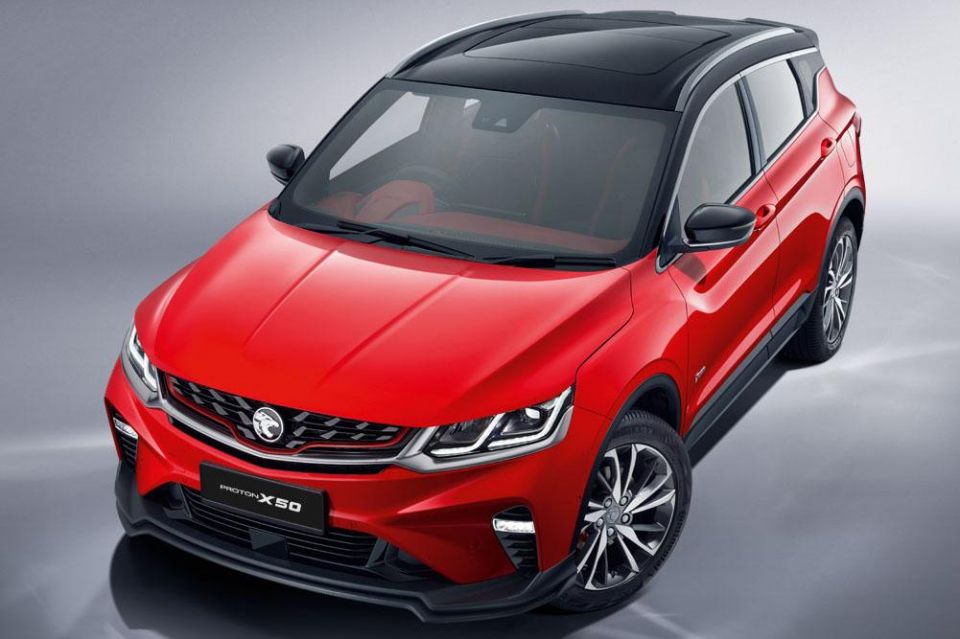
During the 1990s, Proton aggressively chased export markets including Australia, but the brand is now almost exclusively reliant on sales in Malaysia.
According to figures from Paul Tan, Proton sold 108,524 cars at home in 2020, meaning just 1192 vehicles were sold beyond Malaysia’s borders.
While Proton’s sales rose despite a two month Coronavirus shutdown, the firm remains Malaysia’s second most popular car brand behind Perodua (220,163).
Proton’s most popular models were the Saga sedan (46,527) and Persona (23,917), both of which were designed in house. Third place belonged to the X70 crossover (21,944), which is essentially a rebadged right-hand drive version of the Geely Boyue.
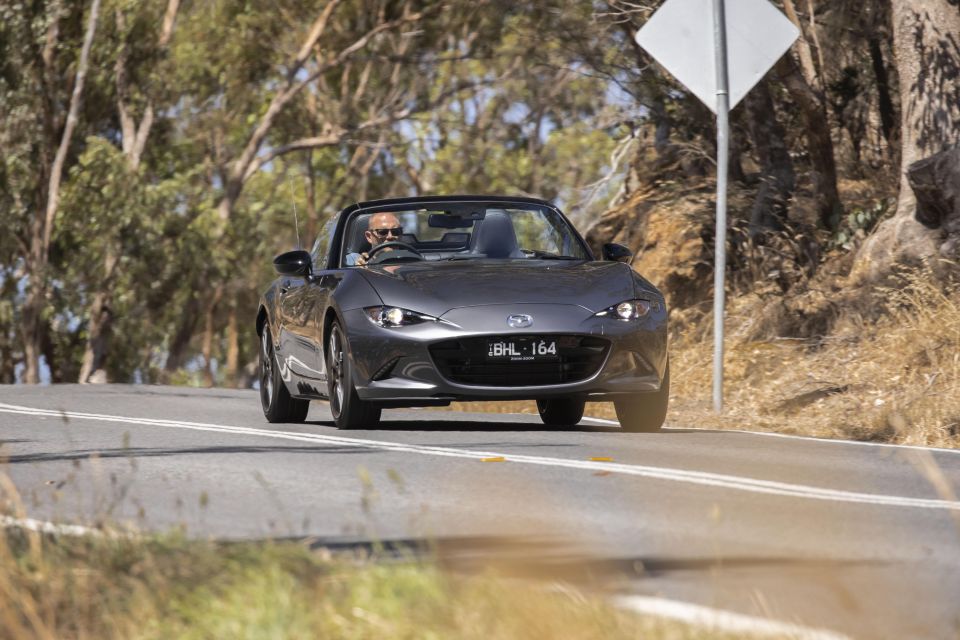
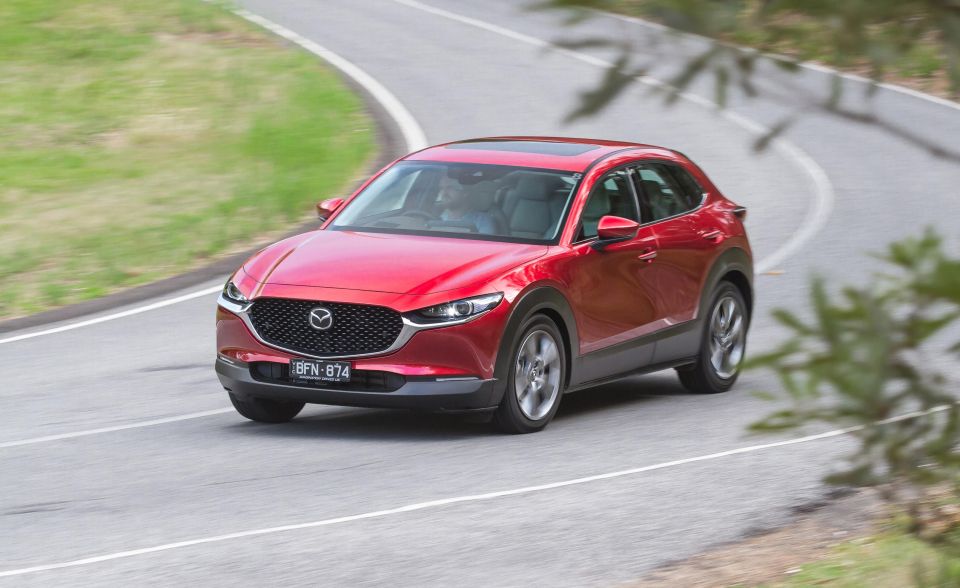
Sales across the globe dropped by 16.9 per cent to 1,243,000, with the steepest fall occurring in Europe.
Despite China and the USA employing wildly different tactics to handle the COVID-19 pandemic and enjoying divergent results, Mazda only saw modest falls in both nations.
| Sales | Change from 2019 | |
|---|---|---|
| USA | 384,000 | -5.4 per cent |
| China | 214,000 | -5.7 per cent |
| Europe | 180,000 | -38.1 per cent |
| Japan | 178,000 | -12.3 per cent |
| Rest of the world | 287,000 | -22.2 per cent |
| – Australia | 85,640 | -12.3 per cent |
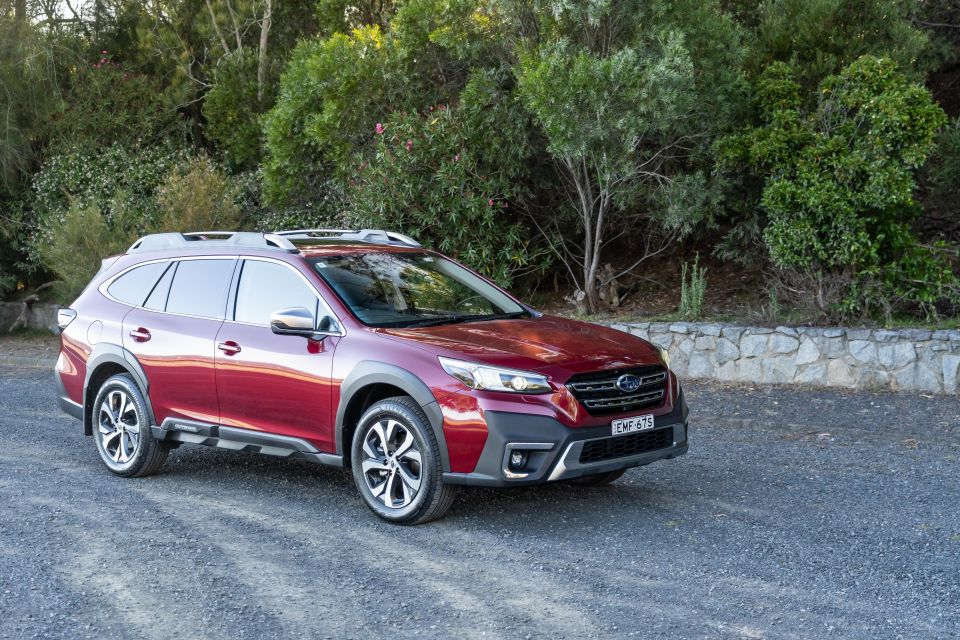
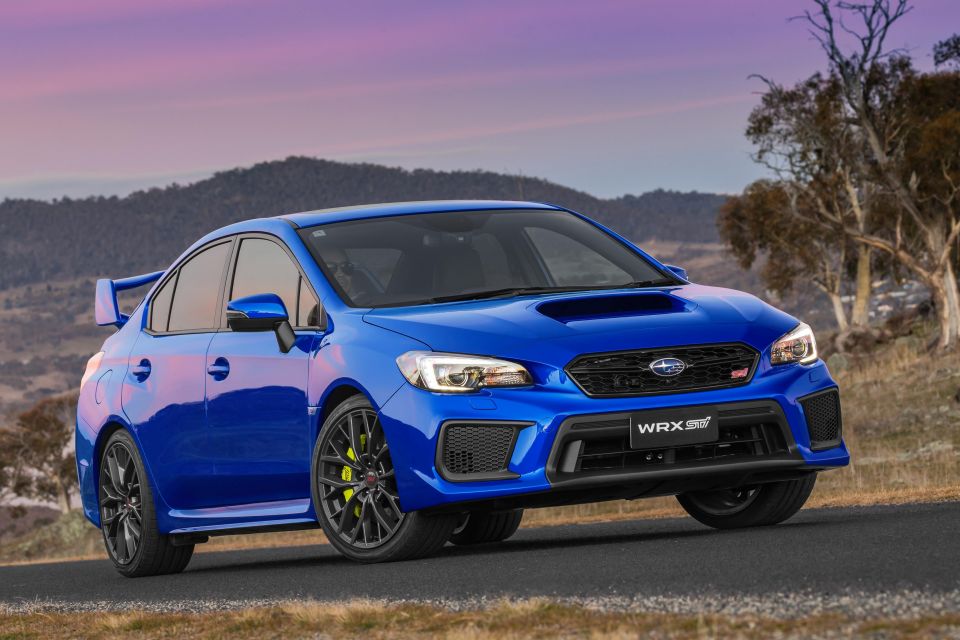
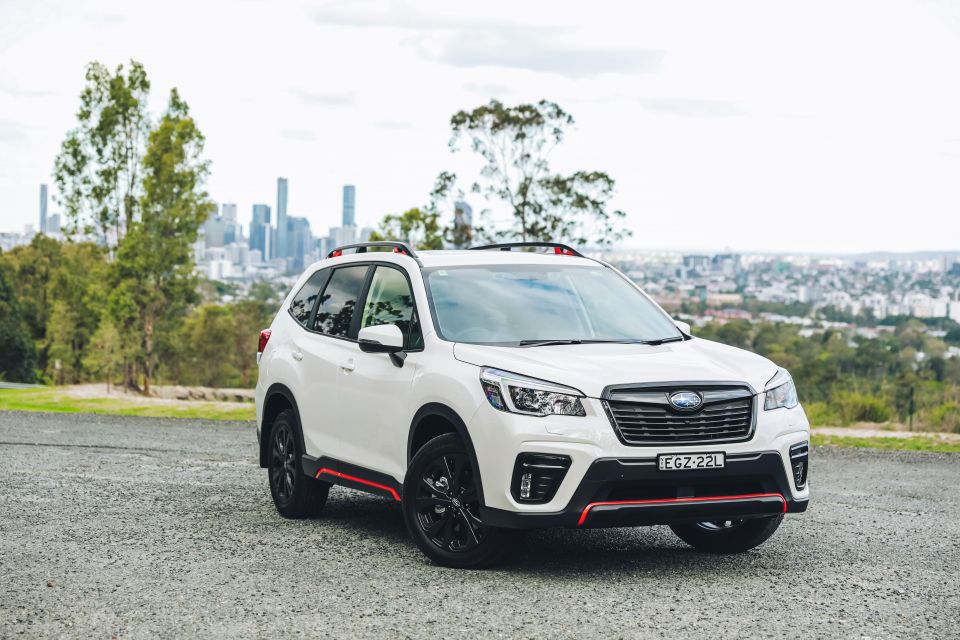
With sales of 894,100 in 2020, Subaru recorded a drop of 11.3 per cent from the prior year.
For casual observers, what’s most surprising about the numbers is the company’s heavy reliance on the US market, which accounts for 71.4 per cent of its sales.
Even the Big Three are less reliant on the USA, with GM deriving only 37 per cent of sales from its home market.
North America accounts for 49.7 per cent of Ford’s 4.2 million vehicles, while Fiat Chrysler’s 2.0 million sales in the region equated to 54.7 per cent of its total.
That figure helps explain why the Legacy sedan and Ascent three-row crossover were developed and are exclusively sold there.
| Sales | Change from 2019 | |
|---|---|---|
| USA | 638,300 | -6.7 per cent |
| Japan | 100,800 | -23.4 per cent |
| Canada | 53,800 | -1.7 per cent |
| Australia | 31,501 | -21.3 per cent |
| China | 23,300 | -1.3 per cent |
| Europe | 21,200 | -32.1 per cent |
In its homeland the automaker sold 20,200 kei cars — all of which are rebadged Daihatsus, thanks to Toyota’s minority stake in Subaru — and 80,600 regular-sized vehicles.
Without a factory in China, Subaru’s presence there is minuscule.
Saddled with heavy import tariffs, Subaru sells fewer vehicles in a country of 1.4 billion than it does in a nation of just under 26 million (that’s Australia, by the way).
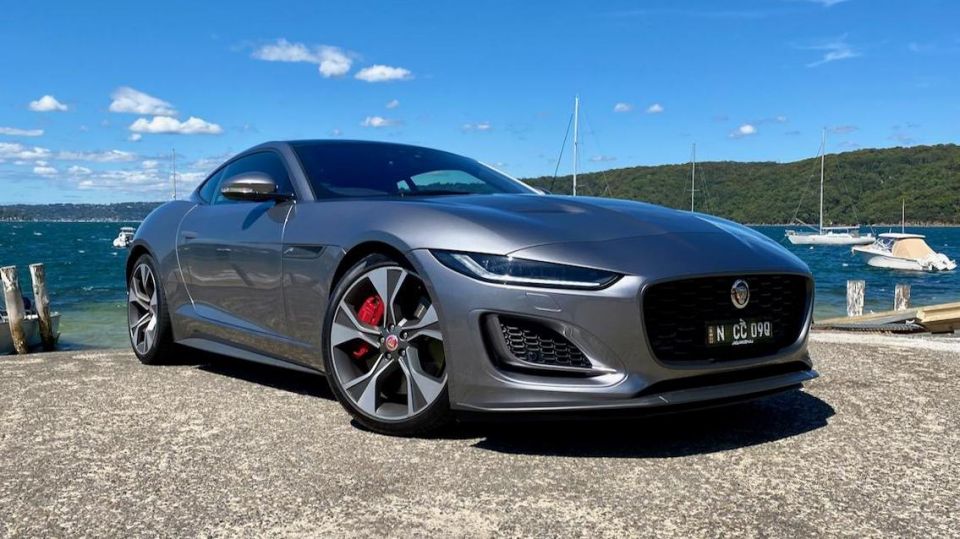

It’s little hard to get a handle on Tata’s sales figures for last year, as the numbers for Jaguar Land Rover provided by Tata and British automaker differ by about 20,000 units.
Suffice to say Tata Motors sold between 570,000 and 600,000 passengers cars globally last year.
According to its own accounting, Jaguar Land Rover was responsible for 425,974 of that total, down 23.6 per cent from the year before.
| Sales | Change from 2019 | |
|---|---|---|
| Jaguar | 102,494 | -36.6 per cent |
| Land Rover | 323,480 | -18.3 per cent |
Land Rover’s top markets were North America, China, and the UK, while Jaguar’s best regions were the UK, China, and Europe.
Overall the group’s sales were split fairly evenly: North America (25 per cent), China (23 per cent), UK (20 per cent), Europe (19 per cent), and the rest of the world (13 per cent).
The top three models in the Land Rover range were the Range Rover Evoque, Range Rover Sport, and the Land Rover Discovery Sport.
Over at Jaguar the best selling cars were the F-Pace, E-Pace, and XE.
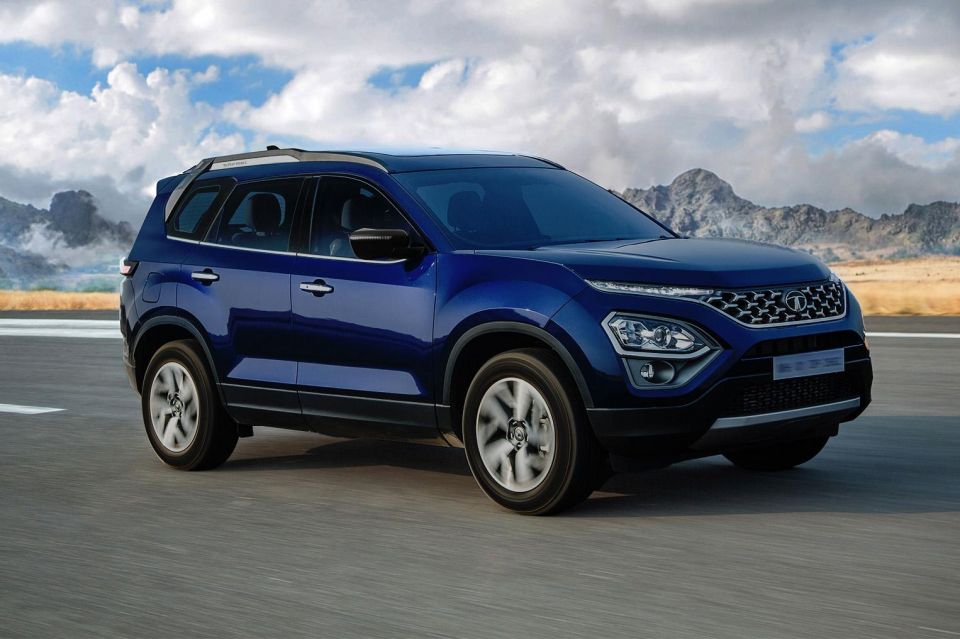
The passenger car division of Tata says it sold 170,697 vehicles last year.
Tata’s commercial truck and bus division makes up a significant portion of the automaker’s sales, according for 231,185 units last year.
If added to the passenger car division, it raises Tata Motors total figure to between 805,000 and 830,000.
Derek Fung would love to tell you about his multiple degrees, but he's too busy writing up some news right now. In his spare time Derek loves chasing automotive rabbits down the hole. Based in New York, New York, Derek loves to travel and is very much a window not an aisle person.


Andrew Maclean
5 Days Ago

Shane O'Donoghue
5 Days Ago

Anthony Crawford
4 Days Ago

Matt Campbell
3 Days Ago

James Wong
2 Days Ago

Max Davies
12 Hours Ago